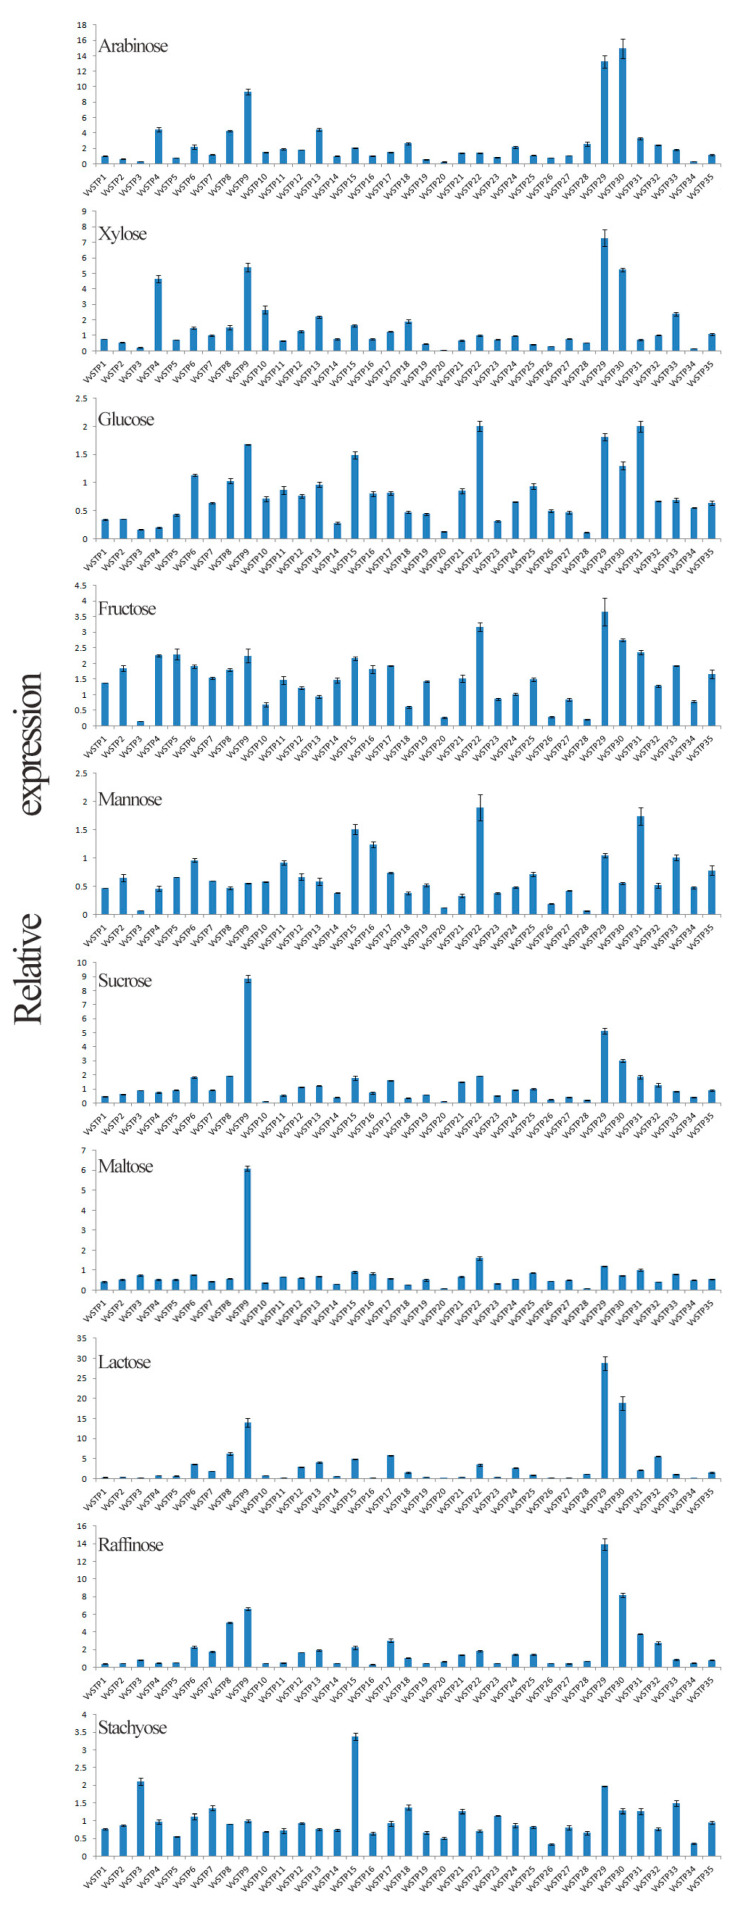
Figure 4.
Expression pattern of VvSTPs on different sole carbon sources analyzed through qRT-PCR. The expression of each VvSTP gene in NM medium without sugar was regarded as a reference and the α-tubulin gene was used as an internal control to normalize the data, and relative expression level was calculated through 2−ΔΔCt method. SDs, shown by error bar, were obtained from three biological replicates.

