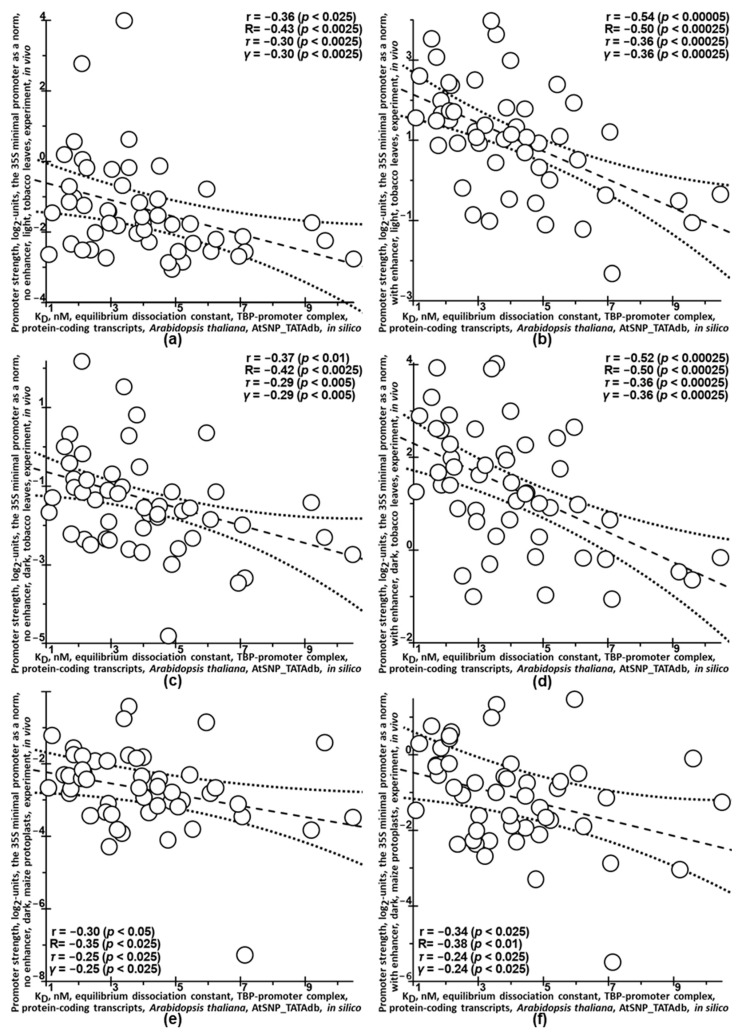
Figure 6.
Statistically significant correlations between the KD-values of the equilibrium dissociation constant expressed in nanomoles per liter (nM) of the complexes between the TBP and only the ancestral alleles of the promoters of the A. thaliana genes as evaluated in silico and stored in the AtSNP_TATAdb (X-axis) and the log2-value of the promoter strength (Y-axis), which were measured in vivo under the experimental conditions described in the caption to this axis on parts (a–f) of this figure according to article [125]. Solid and dash-and-dot lines denote linear regression and boundaries of its 95% confidence interval, calculated by means of software package STATISTICA version 10.0 (StatsoftTM, Tulsa, OK, USA). Statistics: r, R, τ, γ and p are coefficients of Pearson’s linear correlation, Spearman’s rank correlation, Kendall’s rank correlation, Goodman–Kruskal generalized correlation, and their p-values (statistical significance), respectively.

