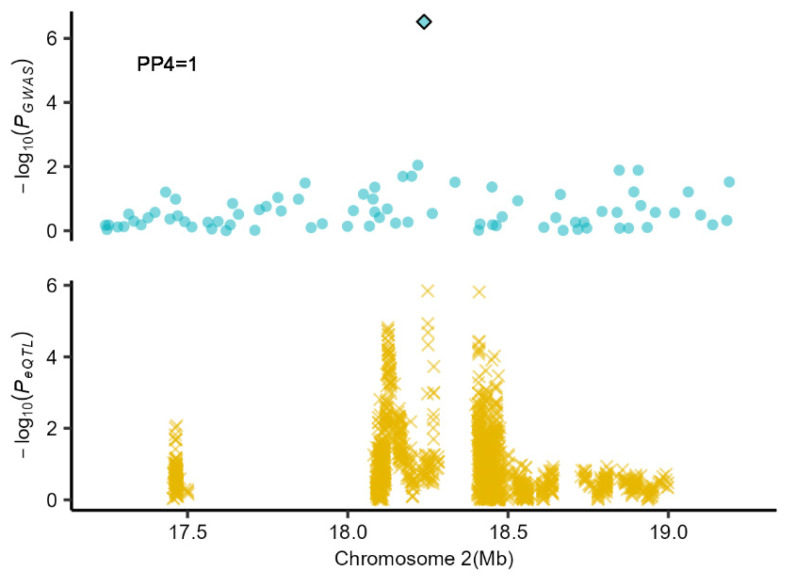
Figure 4.
The local Manhattan plot for the independent variants 2_18237854 and eQTL mapping in the single-breed GWAS meta-analysis (muscle). The top panel was the meta-GWAS analysis result, and the blue rhombus was the independent variant 2_18237854, the bottom panel represents the eQTL mapping results in muscle.

