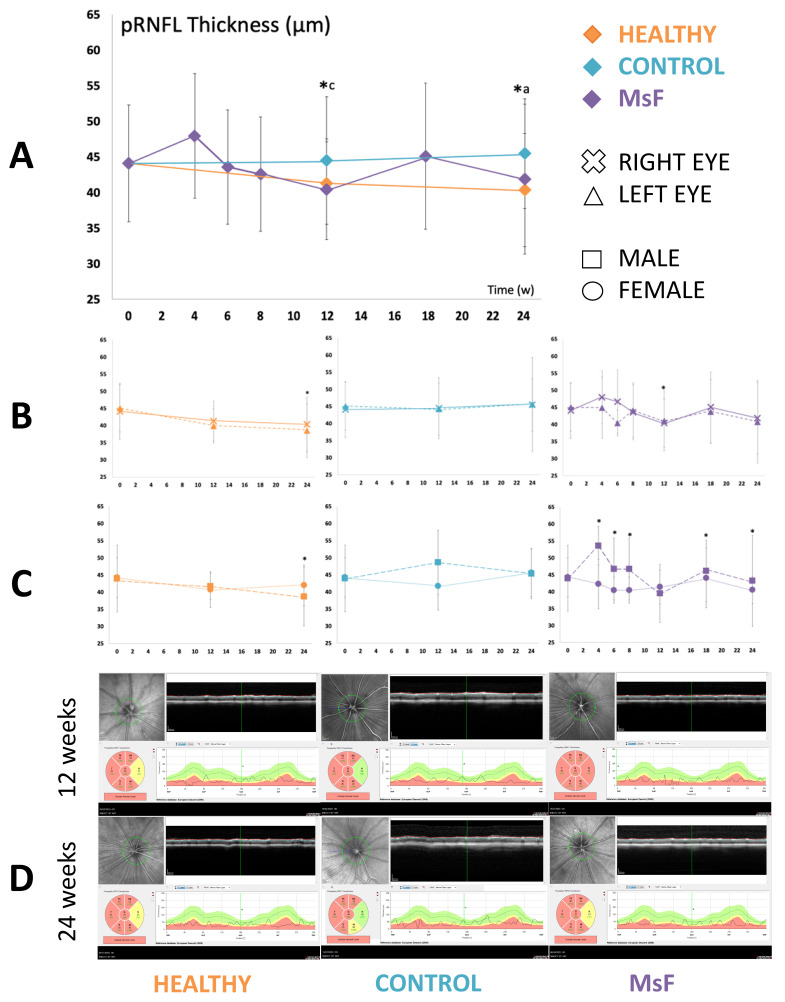
Figure 7.
pRNFL thickness measured by OCT. Comparison of pRNFL thickness curves in the three cohorts (A). Healthy: non-injected cohort; Control: cohort injected with non-loaded PLGA-Ms suspension; MsF: cohort injected with FN-PLGA-Ms suspension. * statistical significance (p < 0.05) between cohorts (ANOVA); a comparison between Healthy and Control cohorts; and c comparison between Control and MsF cohorts. Subanalysis by eye bilaterality (B) and by sex (C) in each model. Representative OCT scans (D). Green color indicates normal situation, red color indicates pathological situation and yellow color indicates borderline situation of this eye.

