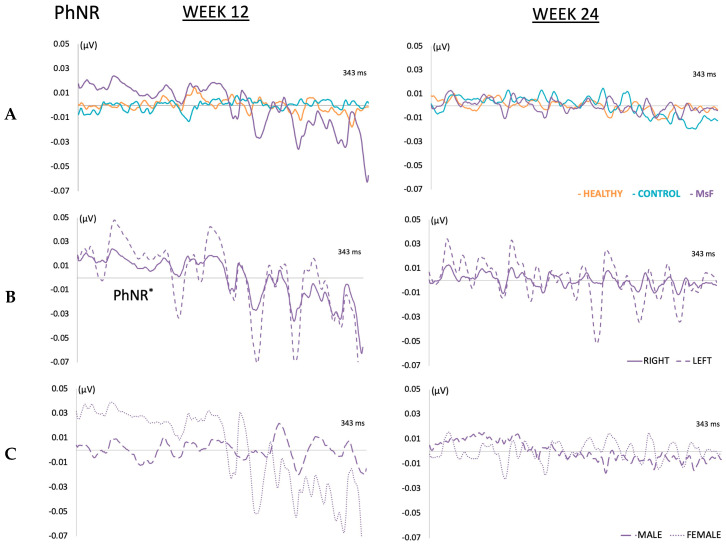
Figure 11.
PhNR. Comparison of PhNR curves in the three cohorts (A). Healthy: non-injected cohort; Control: cohort injected with non-loaded PLGA-Ms suspension; MsF: cohort injected with FN-PLGA-Ms suspension. Study of bilaterality (B) and by sex (C) in MsF cohort. *: statistical significance (p < 0.05).

