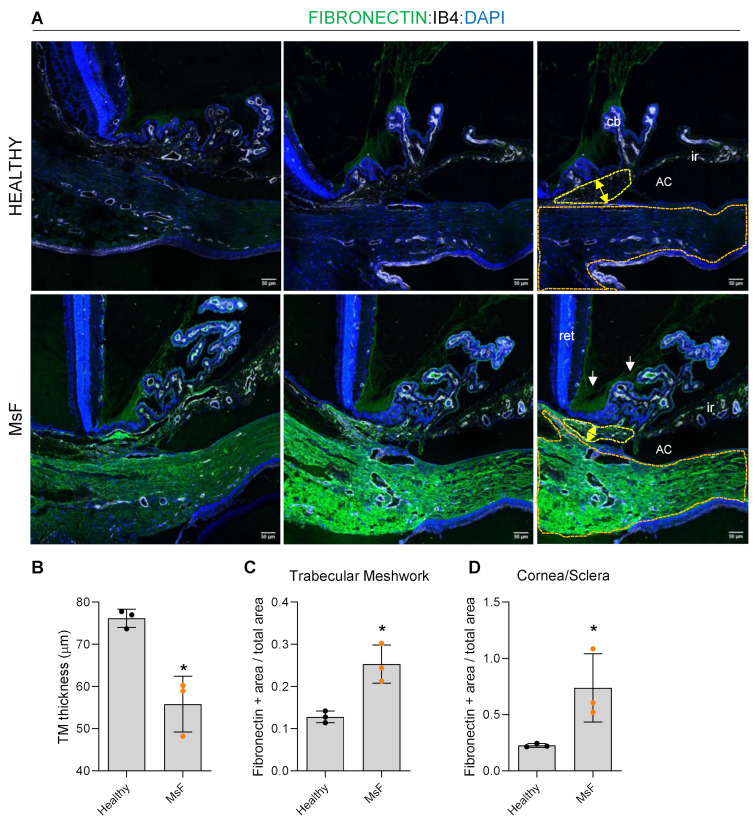
Figure 14.
Histological analysis of the irideocorneal angle at 12 weeks post-injection. (A) Representative images of measures of trabecular meshwork (TM) thickness (yellow arrows and yellow area depicted) and fibronectin deposition (green staining) in both TM, cornea/sclera (orange area depicted) and zonula (white arrows) in the Healthy and MsF cohorts. Quantifications are represented in (B–D) graphs. Healthy: non-injected cohort; MsF: cohort injected with FN-PLGA-Ms suspension. *: statistical significance (p < 0.05). AC: anterior chamber; ret: retina; cb: ciliary body; ir: iris.

