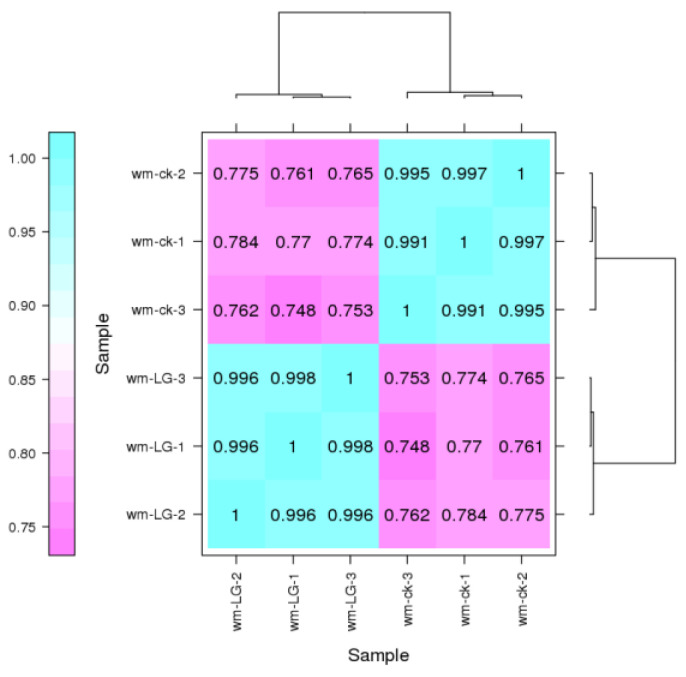
Figure 2.
Expression calorimetry of correlation between two samples. Pearson’s correlation coefficient was used as an index to evaluate the biological reproducibility. The closer R2 is to 1, the stronger the correlation between the two samples is. The CK and LG samples had three biological duplications.

