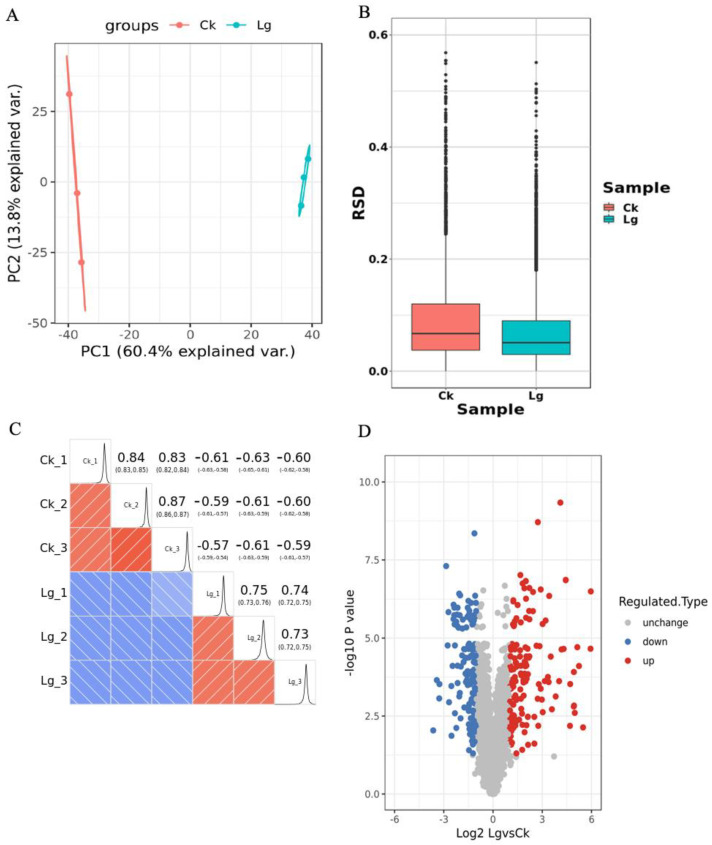
Figure 4.
Analysis of protein data reproducibility and scatter plot of differential expression proteins. (A) Quantitative principal component analysis scatter plot of protein between repeated samples. (B) A boxplot of quantitative RSD distribution of proteins between repeated samples. (C) Heatmap of Plzeň correlation coefficient for protein quantification between two samples. (D) Differential expression protein quantitative volcano plot. Horizontal axis for protein expression log2 value. Vertical axis for protein expression −log10 p-value.

