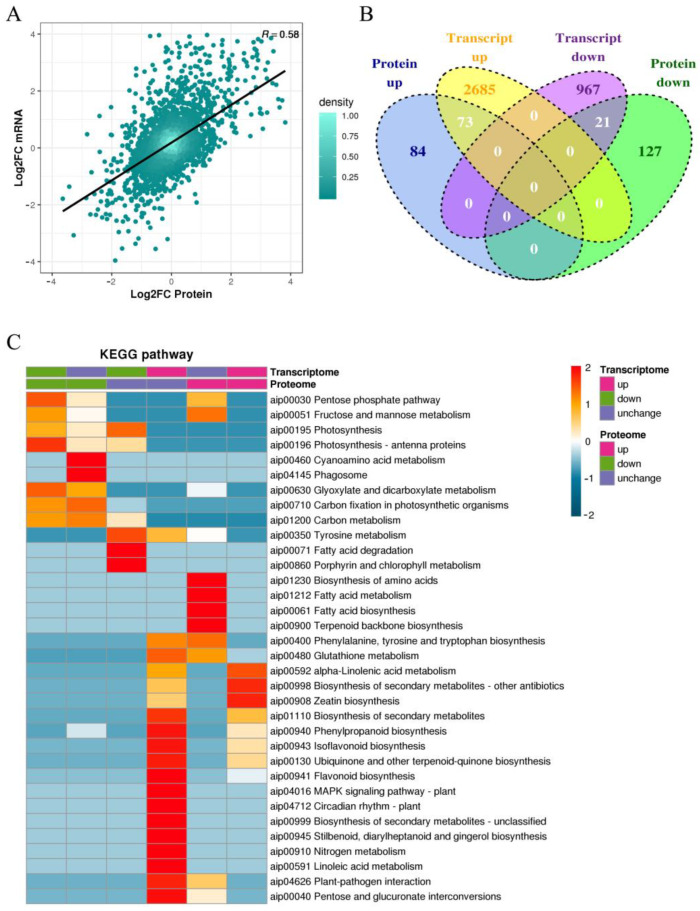
Figure 6.
Correlation analysis of the transcriptome and proteome sequencing. (A) The scatter plot of the transcript and its corresponding protein expression. The vertical axis is DEG p-value in log2FC and the horizontal axis is DEP p-value in log2FC. (B) The Venn diagram of DEPs and DEGs in these six regulatory types. (C) Cluster heatmap of DEPs and DEGs enriched in KEGG pathway in six regulatory relationships.

