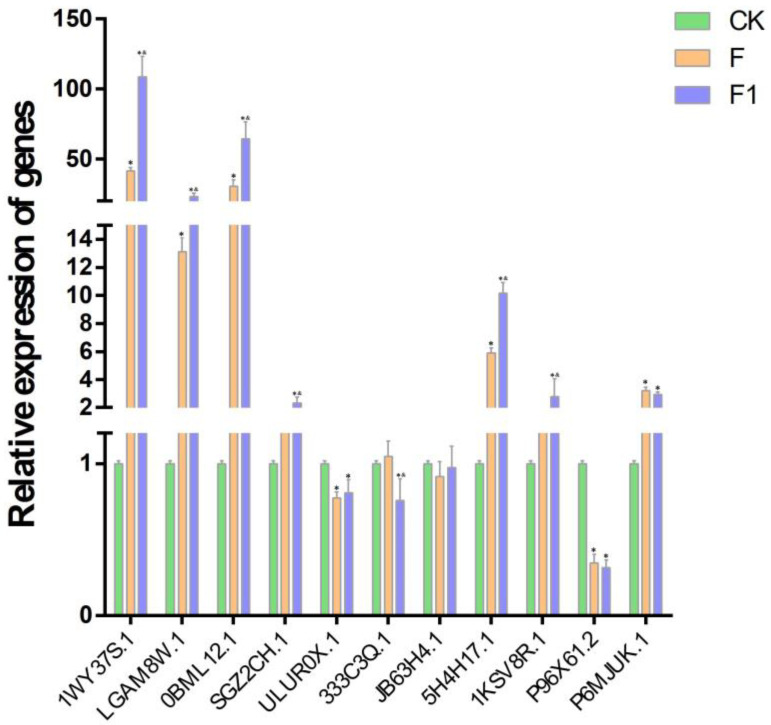
Figure 7.
Expression characteristics of 11 genes in phenylpropane metabolism pathway. Horizontal coordinates: peanut genes. Vertical coordinates: gene expression fold. CK: control sample not inoculated with F. oxysporum. F: sample inoculated with F. oxysporum for 3 days. F1: sample inoculated with F. oxysporum for 7 days. Each error bar represents the mean ± standard deviation of 3 repetitions. * means p-value < 0.05 for CK vs. F/F1. & means p-value < 0.05 for F vs. F1.

