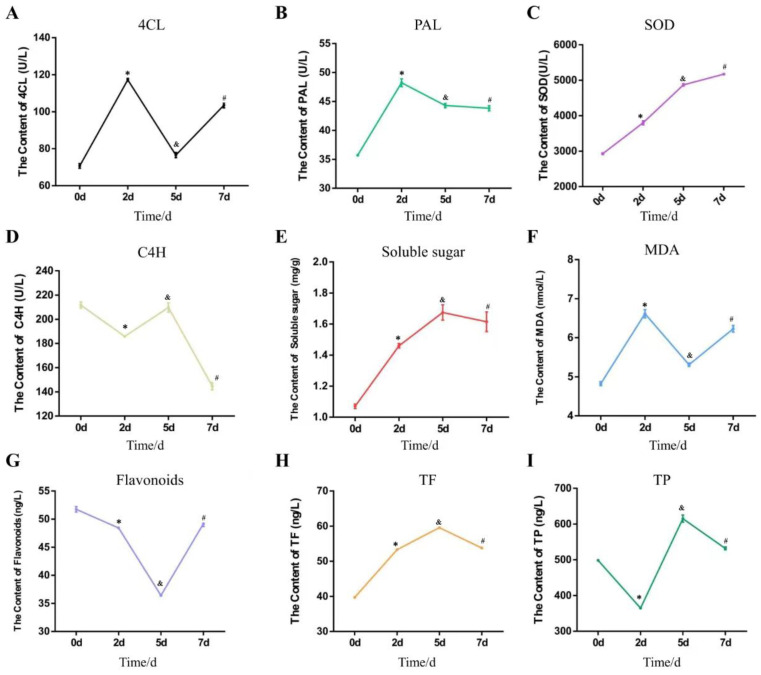
Figure 9.
The trends of the contents of 5 metabolites and the activities of 4 key enzymes. The horizontal coordinate is the time of inoculation with F. oxysporum. The vertical coordinate is the activity data of enzyme or the content of metabolite. (A). The content of 4CL: 4-coenzyme A ligase. (B). The content of PAL: phenylalanine ammonia lyase. (C). The content of SOD: Superoxide dismutase. (D). The content of C4H: cinnamic acid-4-hydroxylase. (E). The content of soluble sugars. (F). The content of MDA: malondialdehyde. (G). The content of plant flavonoids. (H). The content of TF: total flavonoids. (I). The content of TP: total plant phenolics. Each error bar represents the mean ± standard deviation of 3 repetitions. * means p-value < 0.05 for 2 d vs. 0 d. & means p-value < 0.05 for 5 d vs. 0 d. # means p-value < 0.05 for 7 d vs. 0 d.

