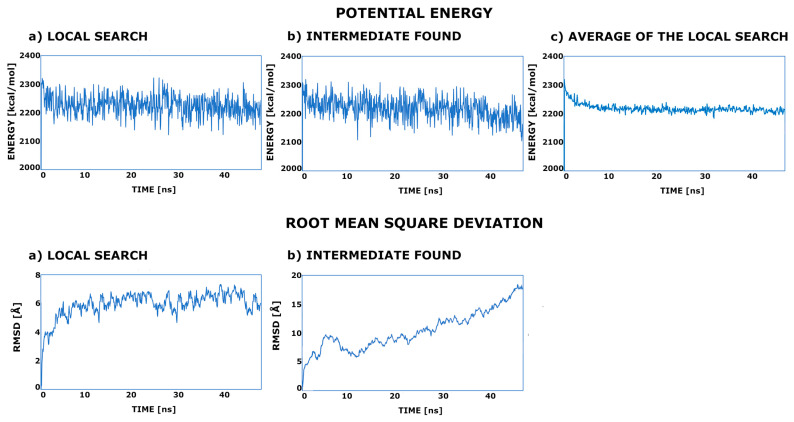
Figure 3.
The potential energy and root mean square deviation plots of the selected MD trajectories of the wt variant: (a) the MD trajectory in which only the local search was performed; (b) the MD trajectory after having led to the intermediate state; (c) the average energy calculated for all simulations in which only a local search was performed.

