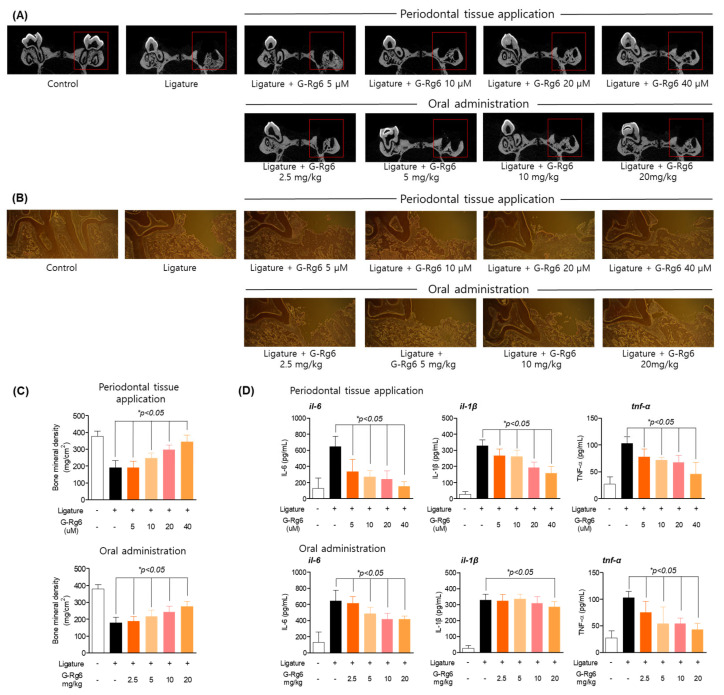
Figure 5.
Inhibitory effects of G-Rg6 on periodontitis in a ligature-induced in vivo model. (A,B) Micro-CT (computed tomography) analysis of extraction socket (red area) and newly formed bone in the application group (upper direction) and oral administration group (bottom). Analysis tables were determined using CTAn software. (C) Histological analysis of the periodontium using hematoxylin and eosin (H&E) staining in the application group (upper) and oral administration group (bottom). (D) Confirmation of the effect of regulating inflammatory cytokines in serum in the application group (left) and oral administration group (right). * p < 0.05, versus the only ligature group. Scale bars denote 20 μm.

