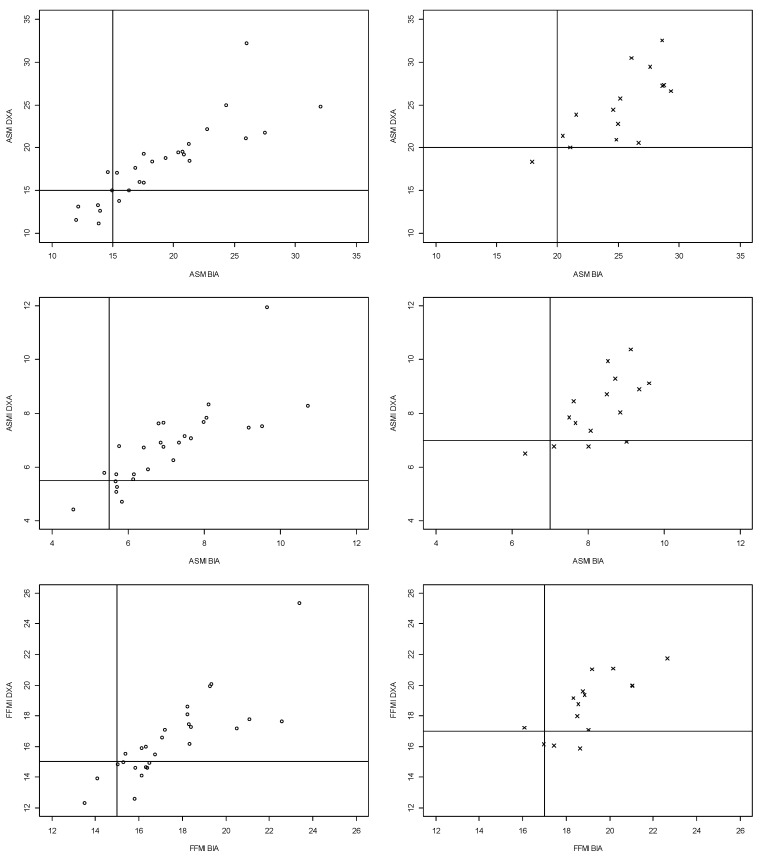
Figure 3.
Scatter plots for agreement between ASM, ASMI, and FFMI estimated by MF-BIA and DXA (absolute values and low muscle mass). Dots show females, and crosses show males. Solid lines represent the cut-off values for low muscle mass. Abbreviations: ASM: appendicular skeletal muscle mass, DXA: dual-energy X-ray absorptiometry, MF-BIA: multi-frequency bioelectrical impedance analysis, ASMI: appendicular skeletal muscle mass index, FFMI: fat-free mass index.

