Figure 1.
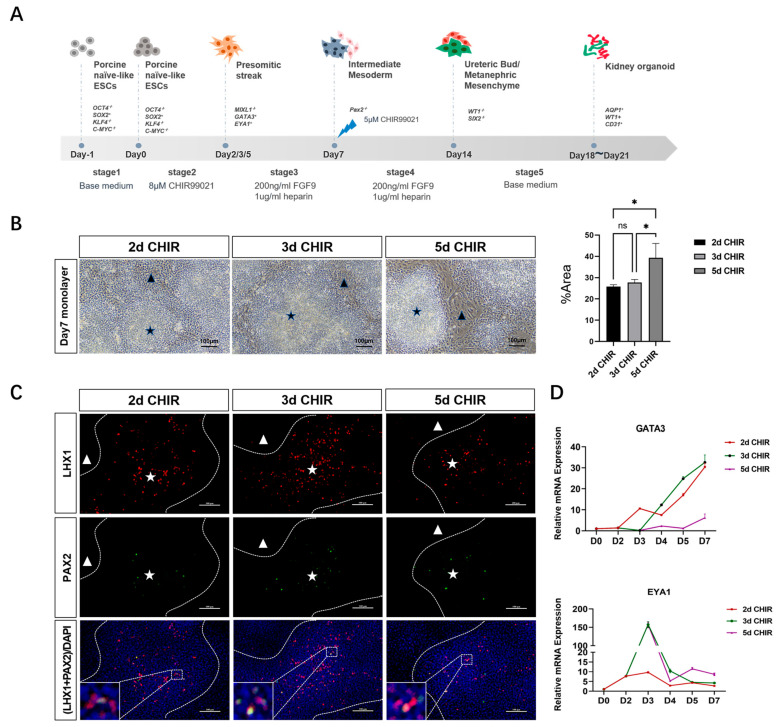
Determination of the treatment duration of CHIR for intermediate mesoderm induction. (A) Schematic diagram of porcine kidney organoids culture. (B) IM cell morphology on the seventh day: the black star shows colony-growth cells and the black triangle shows plane-grown cells (scale bar: 100 μm) (The “percentage area” in (B) represents the percentage of plane-grown cells area in the whole field). (C) The expression of anterior IM markers LHX1 and PAX2 of colony-growth cells was detected by immunofluorescence assay (The dotted line represents the boundary between colony-growth cells and plane-grown cells; the white star and white triangle show colony-growth cells and plane-grown cell, respectively; LHX1 and PAX2 were all localized in the nucleus) (scale bar: 100 μm). (D) The relative expression of anterior IM marker GATA3 and posterior IM marker EYA1 in different CHIR99021 cultures was detected by real-time PCR. * p < 0.05; ns, not significant.

