Figure 4.
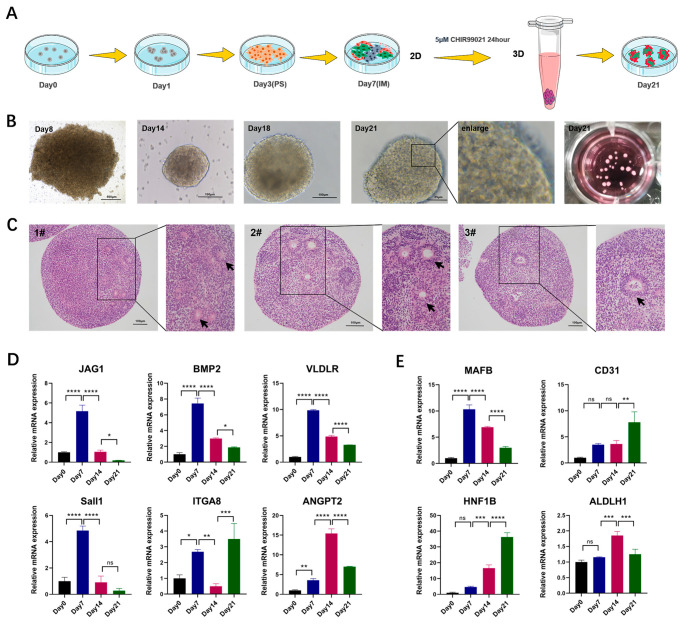
Generation and gene expression of porcine kidney organoids in 3D culturing environment. (A) Schematic diagram of 3D porcine kidney organoids culture. (B) Morphology of porcine kidney organoids on different culture days. (C) H&E staining of porcine kidney organoids (scale bar: 100 μm). (D) Expression level changes in renal progenitor cell markers at 4 time points (day 0, 7, 14, and 21) of the 3D porcine kidney organoids. The relative expression levels of markers of early nephrons (JAG1, BMP2), nephrogenic stroma (Sall1, ITGA8), ureteral buds (VLDLR), and endothelial progenitor cells (ANGPT2) were measured by real-time PCR. (E) Expression level changes in mature nephron components markers at 4 time points (day 0, 7, 14, and 21) of the 3D cultured porcine kidney organoids. The relative expression levels of markers about podocytes (MAFB), endothelial cells (CD31), proximal tubules (HNF1B), and distal tubules (ALDLH1) were measured by real-time PCR. Each value was averaged from three replicates and presented as mean ± SD. * p < 0.05; ** p < 0.01; *** p < 0.001; **** p < 0.0001; ns, not significant.

