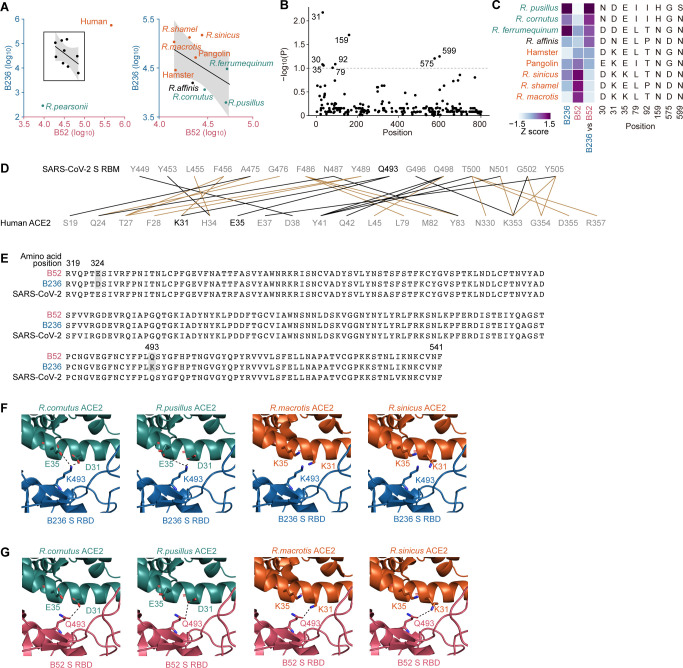
FIG 2.
Interaction between Rhinolophus bat ACE2 and the S proteins of two Laotian SC2r-CoVs. (A) Inverse correlation of the ACE2 susceptibility to B236 and B52 infection. The boxed region is zoomed in on the right panel. (B) Association between B52 and B236 infectivity and ACE2 polymorphism among animal species. The association between the relative infectivity [log10(B236 infectivity/B52 infectivity)] for each ACE2 protein and each polymorphic amino acid site was evaluated by one-way ANOVA. Dashed line, P = 0.1. Outlier species (human and R. pearsonii; gray dots in Fig. 2A) were excluded from the analysis. (C) Amino acid sites associated with the B236 and B52 infection tropisms. Heatmaps of the Z scores of B236 infectivity, B52 infectivity, and relative infectivity are shown on the left. (D–F) Structural insights into the binding of S RBD and ACE2 proteins. (D) The scheme of interaction between the SARS-CoV-2 S receptor binding motif (top) and human ACE2 (bottom). The salt bridge or hydrogen bond is indicated in black, and the van der Waals interaction is indicated in brown. Q493 of SARS-CoV-2 S and K31 and E35 of human ACE2 are indicated in black. This information is referred to in a previous report (17). RBM, receptor binding motif. (E) Amino acid alignment of the RBDs of B52 and B236. Residues with nonsynonymous substitutions between B52 and B236 are shaded in gray. The alignment was plotted by Multiple Align Show (https://www.bioinformatics.org/sms/index.html). (F) The structural model of the complex of B236 S RBD (blue) and the homology model ACE2 of R. cornutus (leftmost, green), R. pusillus (the second from the left, green), R. macrotis (the second from the right, orange), or R. sinicus (rightmost, orange), respectively. The model was reconstructed by using the co-structure of B236 S RBD and human ACE2 (PDB: 7PKI, https://www.rcsb.org/structure/7PKI) (6) as templates and homology models. The residue 493 of B236 S RBD and the residues 31 and 35 of ACE2s are indicated as stick models. Dashed lines indicate salt bridges. (G) The structural model of the complex of B52 S RBD (red) and the homology model ACE2 of R. cornutus (leftmost, green), R. pusillus (the second from the left, green), R. macrotis (the second from the right, orange), or R. sinicus (rightmost, orange), respectively. The model was reconstructed by using the co-structure of B236 S RBD and human ACE2 (PDB: 7PKI, https://www.rcsb.org/structure/7PKI) (6) as templates and homology models. The residue 493 of B52 S RBD and the residues 31 and 35 of ACE2s are indicated as stick models. Dashed lines indicate hydrogen bonds.

