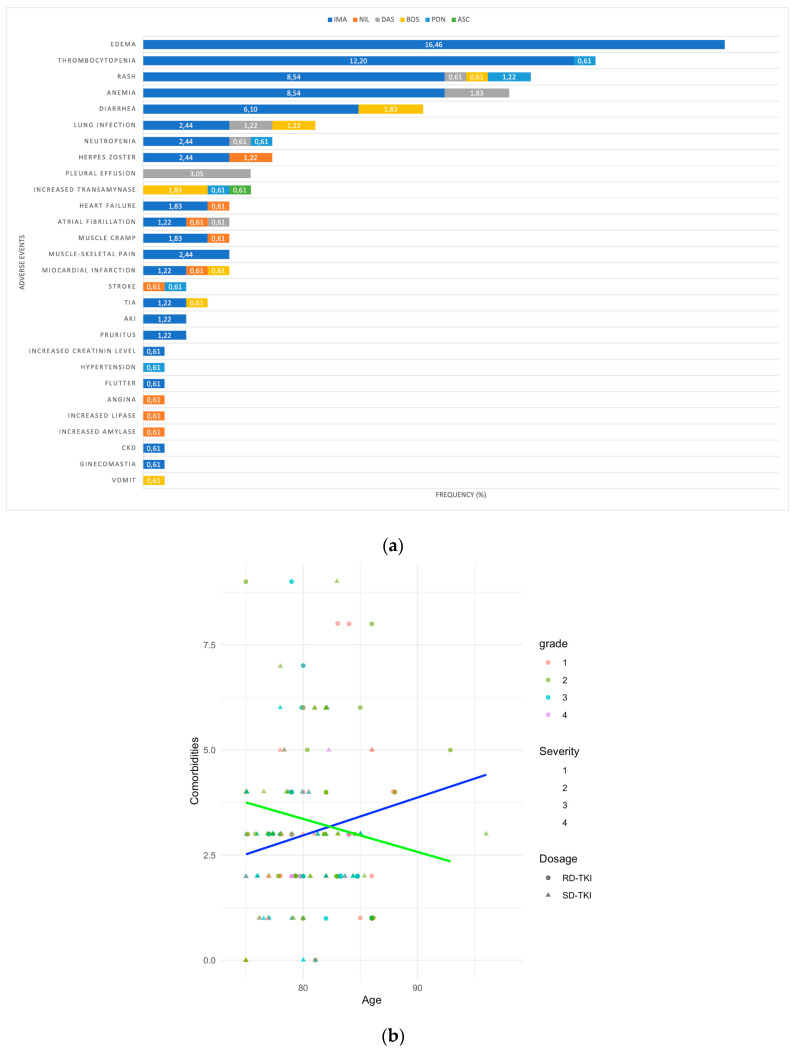
Figure 4.
(a) Frequency of adverse events (AEs) by drug: bar chart illustrating frequency of AEs categorized by drug in the cohort. (b) Association of AEs with age and comorbidities: scatter plot depicting the relationship between age (years) and number of comorbidities with regression lines for Standard dose-TKIs (blue line) and Reduced dose-TKIs (green line). AKI, Acute Kidney Injury; CKD, Chronic Kidney Disease; TIA, Transient Ischemic Attack.

