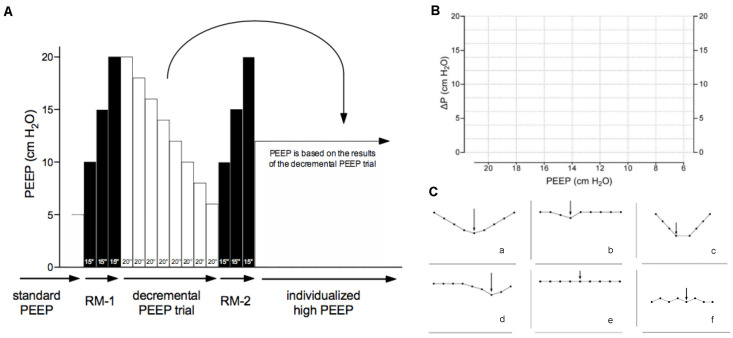
Figure 1.
(A) Patients allocated to the ‘individualized high PEEP’ group receive a first recruitment maneuver (RM) followed by a decremental PEEP titration and a second RM. The RMs are performed with the ventilator in a volume-controlled ventilation modus and with the respiratory rate set at 15 breaths per minute. An inspiratory pause is manually set at 30%. Every 15 s, PEEP is incrementally increased from 5 cm H2O with steps of 5 cm H2O up to 20 cm H2O. The decremental PEEP titration starts at the end of the first RM at PEEP 20 cm H2O, with ventilator in a volume-controlled ventilation modus, and with the respiratory rate set at 15 breaths per minute. In steps of 20 s, PEEP is stepwise decreased steps of 2 cm H2O for 20 s until a minimum level of 6 cm H2O is reached. At the end of each step, the resulting ΔP is calculated by subtracting PEEP from the plateau pressure. A second RM follows the decremental PEEP titration, after which PEEP is set and kept at the highest level where ΔP was lowest. (B) A bedside ‘ΔP–PEEP’ graph is to be constructed by plotting the ΔP against PEEP using the empty chart. (C) From this ‘ΔP–PEEP’ graph, we can visually observe a nadir in ΔP, and identify the highest level of PEEP with the lowest ΔP (represented in subpanels (a–d) with the arrow). If no nadir in ΔP is present in the ΔP–PEEP graph (represented in subpanels (e,f)), we use a PEEP level of 12 cm H2O.

