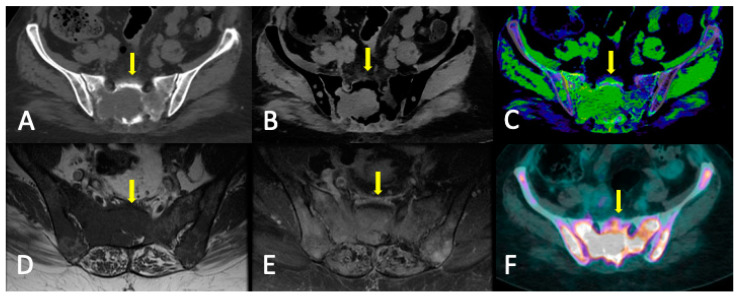
Figure 6.
Sacral lytic lesion (yellow arrows) and diffuse marrow infiltration in the pelvis as the debut of MM with good correlation among conventional CT, DECT, MRI, and FDG-PET/CT. (A) Conventional CT. ROI average, 46 HU. (B) DECT VNCa grayscale (CaSupp index 25). ROI average, 3.2 HU. (C) DECT VNCa (CaSupp index 25) color-coded scale. (D) T1WI. (E) FST1WI after intravenous gadolinium administration. (F) FDG-PET/CT. Suvmax 29.5.

