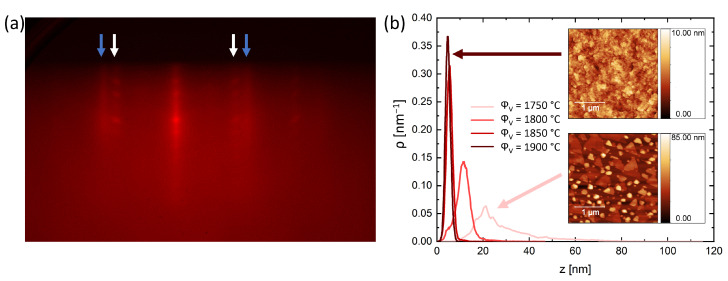
Figure 3.
(a) RHEED pattern for = 1750 C showing a double streak pattern related to the phases BiTe with 4.31 Å and VTe with 3.59 Å, indicated by the blue and white arrows, respectively. (b) Height distribution at the surface as a function of the . The insets show the surface morphology of the samples with = 1750 C and = 1900 C.

