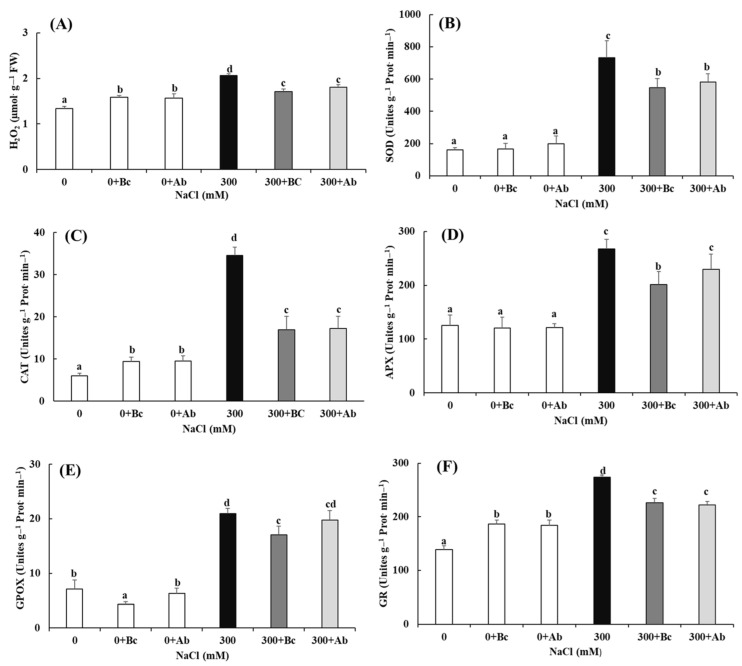
Figure 7.
The difference in (A) H2O2 content and the enzymatic activities of (B) SOD, (C) CAT, (D) APX, (E) GPOX and (F) GR in leaves of Chenopodium quinoa Willd. (variety ICBA-5) plants after culture without additional NaCl or 27 days of salt treatment. Values represent mean ± SE (n = 5), and the different letters a to d indicate significant differences between the treatments. Control (0), 300 mM NaCl (300), biochar (Bc), absorber (Ab).

