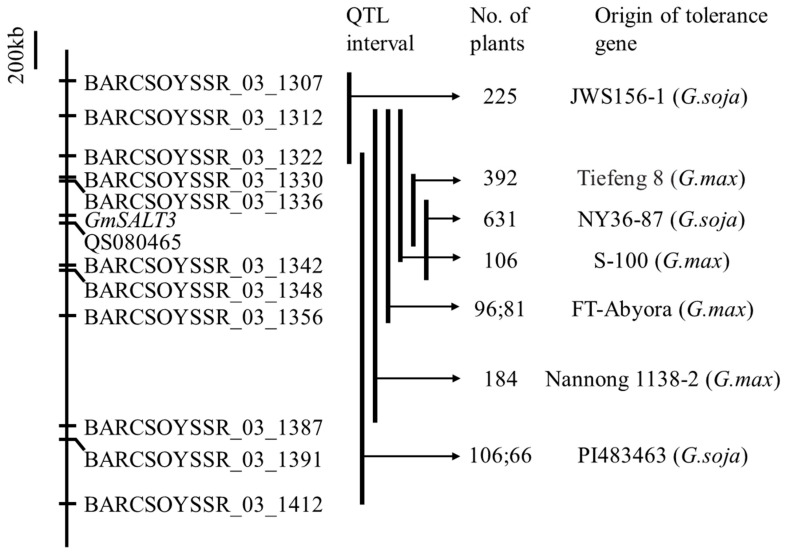
Figure 1.
Schematic of salt tolerance QTL/gene mapping interval in Chr. 03 at the seedling stage. Bold vertical lines signify the QTL interval in each study, and the origin of the salt tolerance gene and the number of individuals in the segregating populations are also marked. All markers are Glyma.Wm82.a2 version [34,46,47,48,49,58,60].

