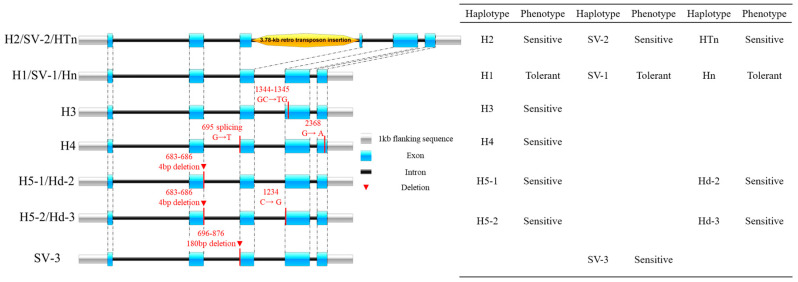
Figure 2.
Main structure and coding variations of GmSALT3 observed in soybean accessions. Blue boxes indicate exons, the black bars represent introns, gray boxes represent the 1 kb flanking sequence of GmSALT3, dotted lines indicate the exon position, orange block represents the 3.78 kb retro transposon insertion, and key variants are listed with red letters (only those haplotypes observed in more than 10 accessions were counted) [72,73,74].

