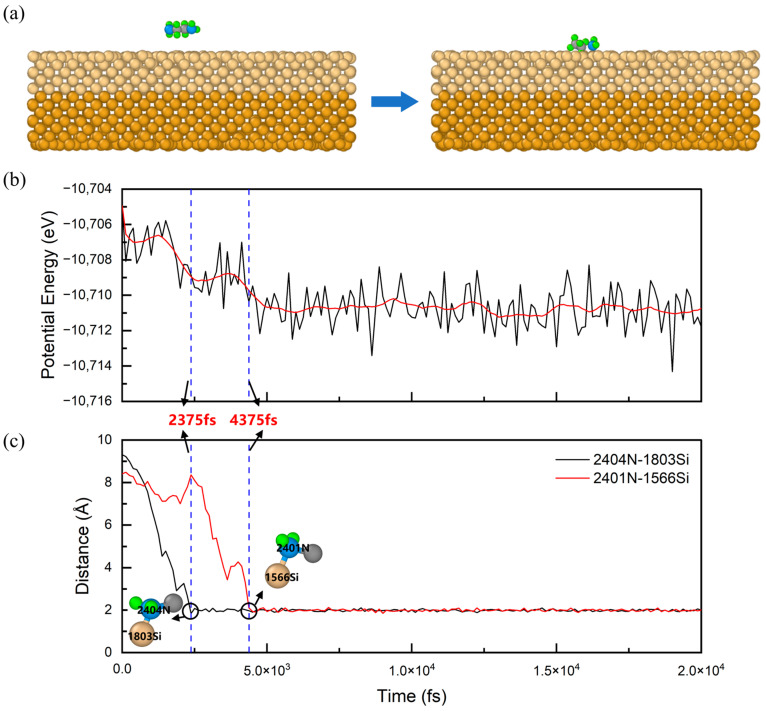
Figure 6.
(a) The schematic diagram of the atomic structure of the EDA–Si system before (left) and after (right) the MD simulation. (b) The potential energy curve for the EDA–Si system. The red line is the smoothed potential energy curve. (c) Internal distance curves of the N–Si atom pairs during the adsorption. The two blue dotted lines in (b,c) correspond to the timepoints of the adsorption of the two N atoms in EDA, respectively. The prefix number on the atom represents the ID number of the atom in the simulation system. The corresponding atomic species of the various colored spheres are shown in Figure 3.

