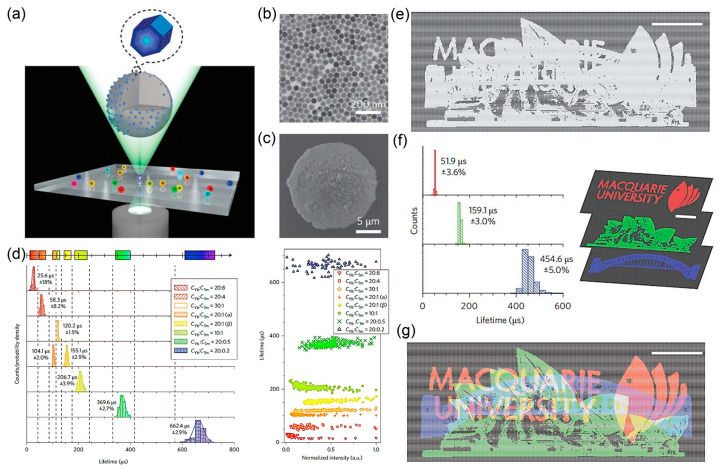
Figure 6.
(a) The flow chart of Tm upconversion nanocrystals introduced into the porous microspheres; (b) TEM image of the nanocrystals and (c) scanning electron microscopy (SEM) image of incorporating the nanocrystals; (d) fluorescence lifetime of various co-dopant concentration of the sensitizer/emitter; (e) the complex picture under single luminescence; (f) the separated patterns based on the lifetime components of every pixel; (g) the decoded genuine multiplexing information contained in the same overlapping space [59].

