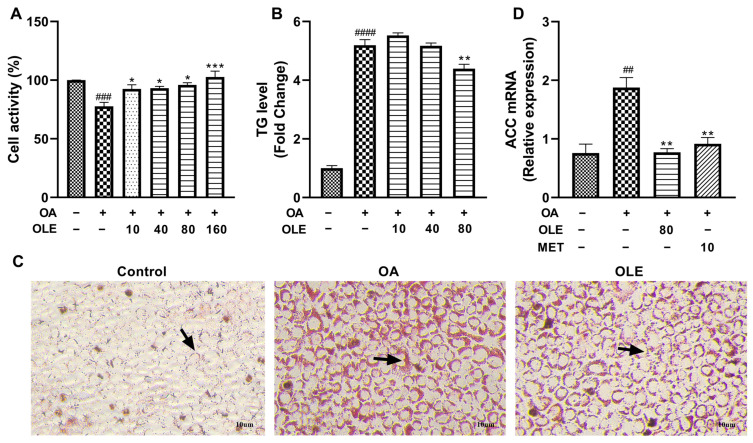
Figure 5.
Effects of OLE on lipid production in OA-induced cells. (A) The activity of AML-12 cells treated with or without OA (0.25 µM) or different concentrations of OLE. (B) TG levels in AML-12 cells untreated or treated with OA or/and OLE. (C) Representative images of AML-12 cells stained with oil red O staining. (D) Relative mRNA expression of hepatic-lipogenesis-related genes (ACC) in cells. Data are presented as mean ± SEM (n = 3). ## p < 0.01, ### p < 0.001, #### p < 0.0001 showed compared to control; * p < 0.05, ** p < 0.01, *** p < 0.001 showed compared to cells treated with OA alone. Arrows indicated the formation of lipid droplets.

