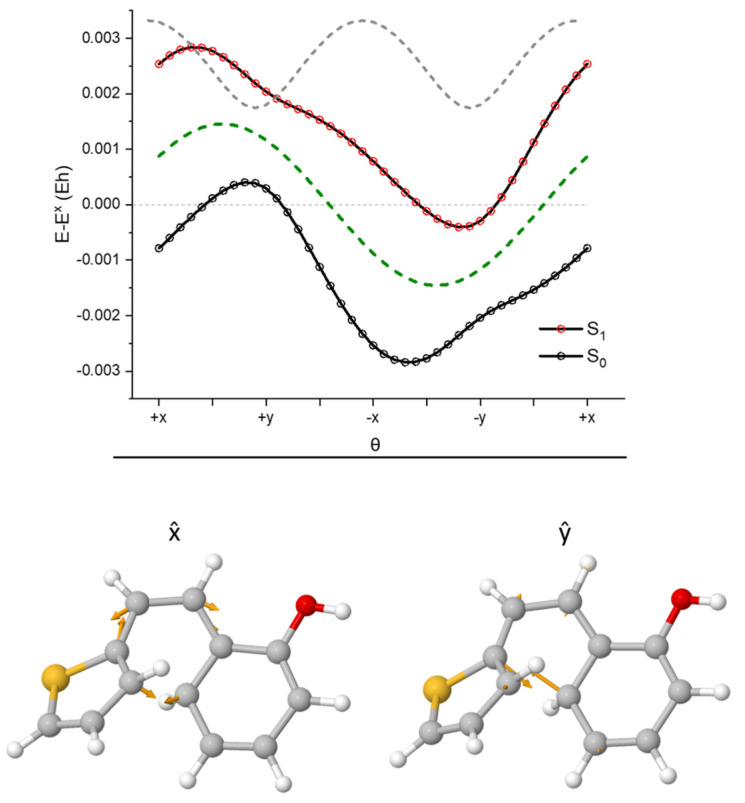
Figure 14.
(Top) plot of S0 (black) and S1 (red) around the conical intersection varying angle θ at a distance of r = 0.01 Å, the dashed lines represent the average energy (green) and the energy difference (grey), the circles are the values obtained from single-point calculations. (Bottom) topology around the CI and the proper (left) and (right) vectors describing it.

