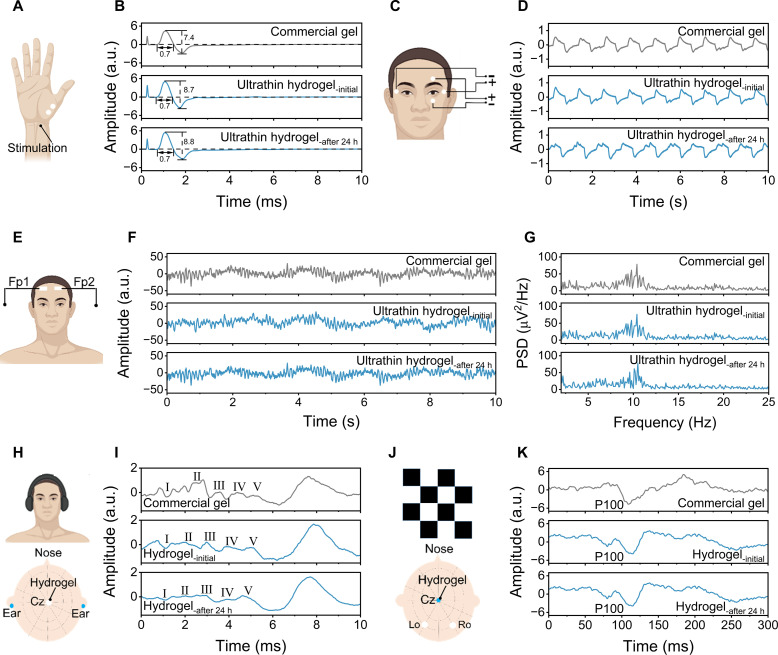
Fig. 5. Other long-term high-fidelity electrophysiological monitoring by the ultrathin hydrogels.
(A) Schematic illustration of the experimental setup for measuring MCV signals. (B) MCV signals recorded by commercial gels and ultrathin hydrogels. (C) Schematic illustration of the experimental setup for measuring EOG signals. (D) EOG signals recorded by commercial gels and ultrathin hydrogels. (E) Schematic illustration of the experimental setup for measuring EEG signals. (F) EEG alpha rhythms recorded by commercial gels and ultrathin hydrogels. (G) The power spectral density of EEG signals obtained from (F). (H) Schematic illustration of the experimental setup for measuring ABR signals. (I) ABR waveforms recorded by commercial gels and hydrogels. (J) Schematic illustration of the experimental setup for measuring VEP signals. (K) VEP signals recorded by commercial gels and hydrogels. All mentioned physiological markers were monitored throughout 24 hours of continuous wearing. a.u., arbitrary units.

