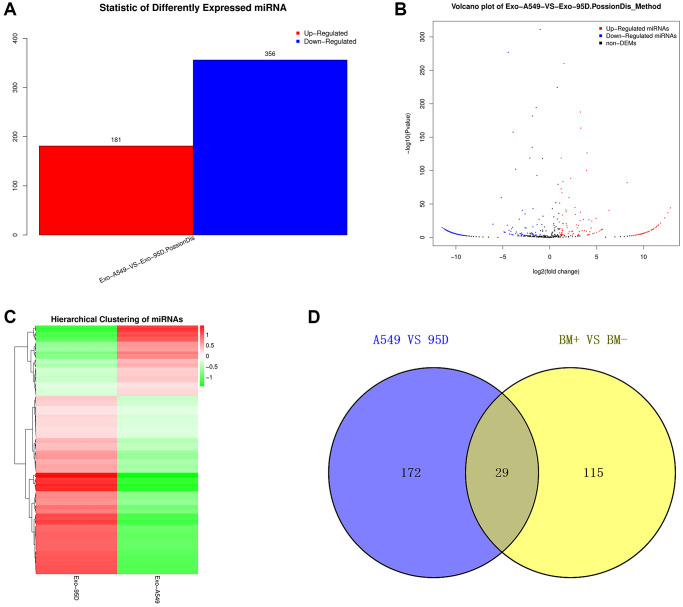
Figure 2.
Analysis of the DE-exo-miRNAs. (A) Histogram showing the upregulated and downregulated DE-exo-miRNAs between the A549 and 95D cells. Red represented upregulated DE-exo-miRNAs; blue represented downregulated DE-exo-miRNAs. (B) The volcano map shows the distribution of DE-exo-miRNAs between A549 and 95D cells according to their P values and fold changes. Red dots represented upregulated DE-exo-miRNAs; blue dots represented downregulated DE-exo-miRNAs; black dots represented non-differentially-expressed miRNAs. (C) Heatmap showing DE-exo-miRNAs from A549 and 95D cells. The colors in the heatmap represented normalized gene expression values, with high expression values being colored in red and low expression values being colored in green. (D) The Venn diagram representing the 29 overlapping exo-miRNAs. Abbreviations: DE-exo-miRNAs: differentially expressed exosomal miRNAs; BM+: patients with bone metastasis; BM-: patients without bone metastasis.

