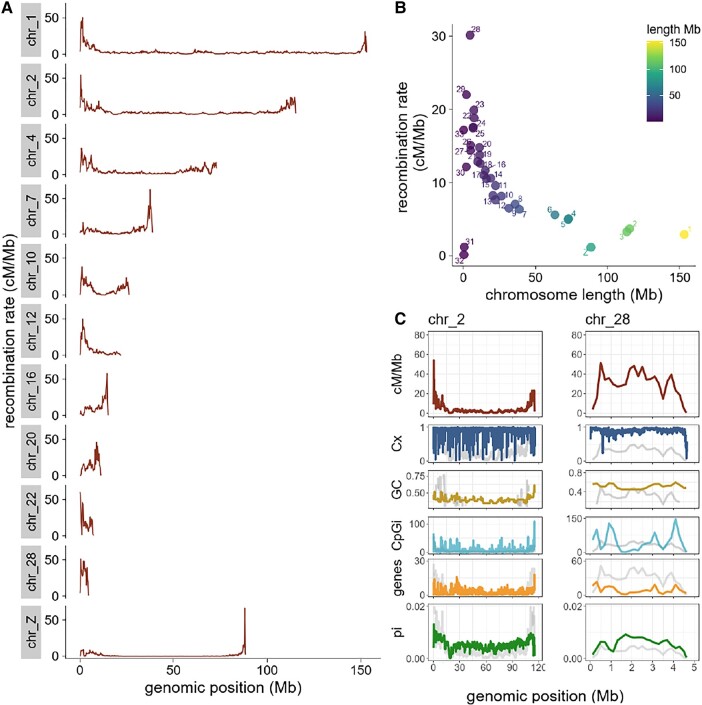
Fig. 1.
Historical recombination map across the genome and within chromosomes in the Eurasian blackcap. A) Recombination rates calculated in 200 kb windows across genomic positions in a subset of chromosomes representative of different sizes. B) The relationship between chromosome size and recombination rate was measured by Kendall's rank correlation coefficient (τ = −0.6, P = 4.7e−08). C) Distribution of recombination rates and genomic features (from top to bottom: complexity Cx, GC content, CpGi density, gene density, and nucleotide diversity as pi) calculated in 200 kb windows across exemplified chromosomes 2 and 28. Recombination patterns are shown for each chromosome (in light gray for reference).

