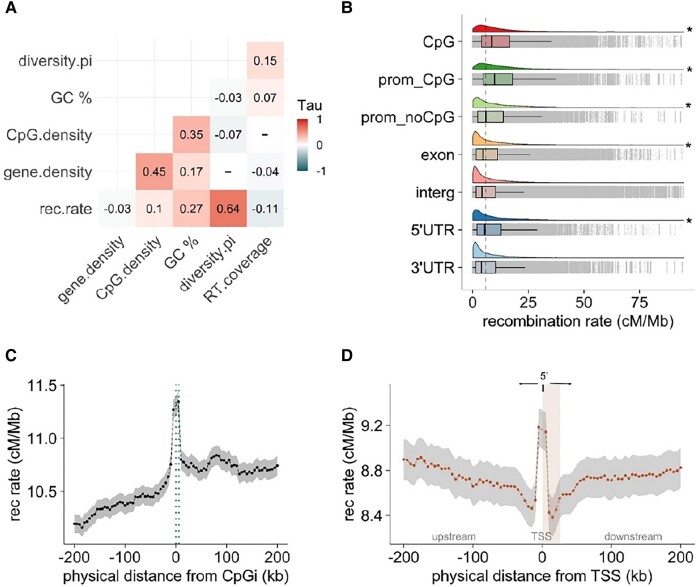
Fig. 2.
Recombination variation is associated with genomic features and functional elements. A) Genome-wide partial Kendall's rank correlations between recombination rates and genomic features calculated in 200 kb windows. All correlations are significant (P < 0.001) except for those marked with (−). B) Cloud plots and box plots show median and average recombination rates in different annotation categories. The color-coded ridgelines (distribution curves) above each box plot show the data distribution for different annotation categories. The dashed line at 5.8 cM/Mb denotes the average genome-wide recombination rate for reference to feature-specific estimates. Features which are annotated with an asterisk (*) indicate a significant deviation of the median recombination, when compared with the genome-wide average recombination rate, assessed using Wilcoxon rank-sum test (with P < 0.001). C) Average recombination rate as a function of distance to the nearest CpG island. Dotted lines indicate the start and end of CpG islands. D) Average recombination rates as a function of distance to the nearest TSS; the vertical shadow (in light orange) denotes mRNA of annotated genes. Dots represent the average recombination rate for each 5 kb window, and the shadow (in gray) denotes 95% confidence intervals.

