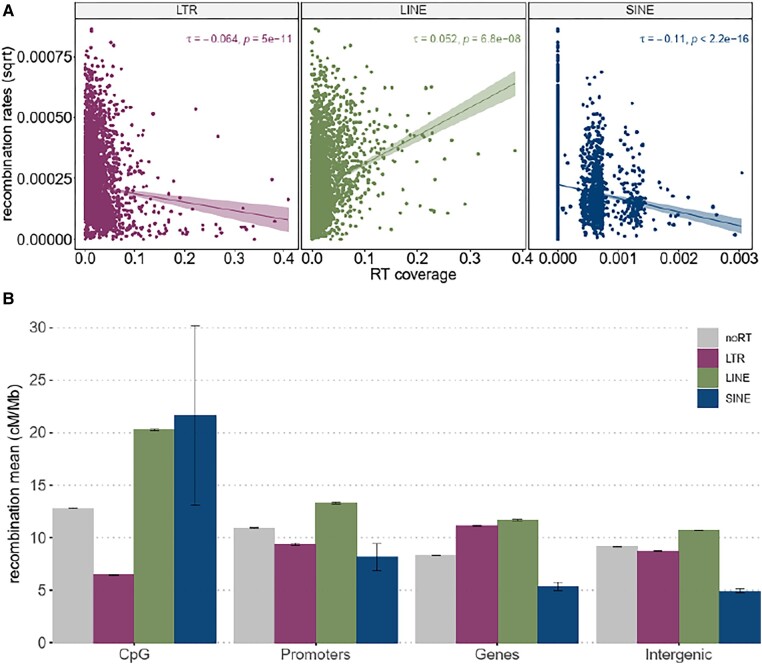
Fig. 3.
Association between recombination rates and RTs. (A) Correlation between recombination rates (square root transformed) and the coverage of 3 types of RT in 200 kb windows measured with Kendall's tau. B) Bar plots showing the mean recombination rate of different annotation features intersecting with and without (gray) different types of RTs. Errors bars represent 95% confidence intervals. The recombination average in genomic features with RTs significantly differs from genomic features without RTs (Wilcoxon rank-sum test, P < 0.05). Average recombination rate of each RT at different genomic features is significantly different (Wilcoxon rank-sum test, P < 0.001), except for SINE in genes and intergenic regions.

