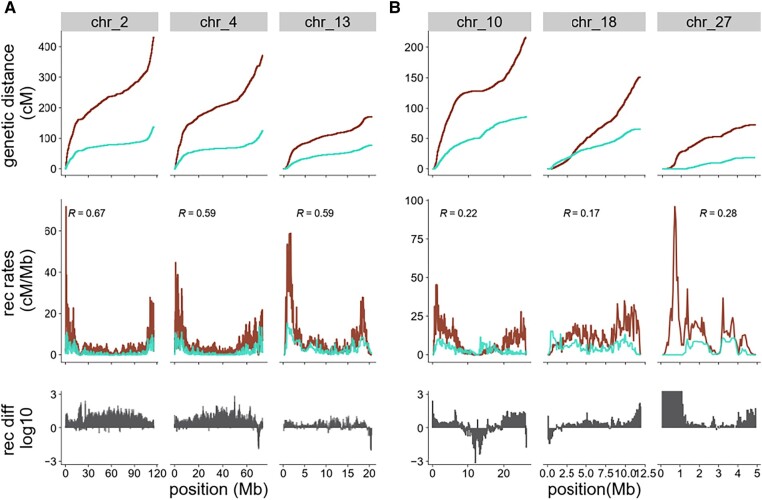
Fig. 4.
Historical recombination map comparison between closely related sister species. Recombination rates and genetic map for blackcap (dark red) and garden warbler (cyan). Different chromosomes show (A) higher similarity and (B) lower similarity of recombination rates between both species. The first row shows genetic distance in cM, and the middle row shows the distribution of recombination rates, including correlation coefficients measured by Kendall's rank correlation. All comparisons are significant (P < 0.001). The third row shows normalized recombination rate difference calculated between both species across different chromosomes.

