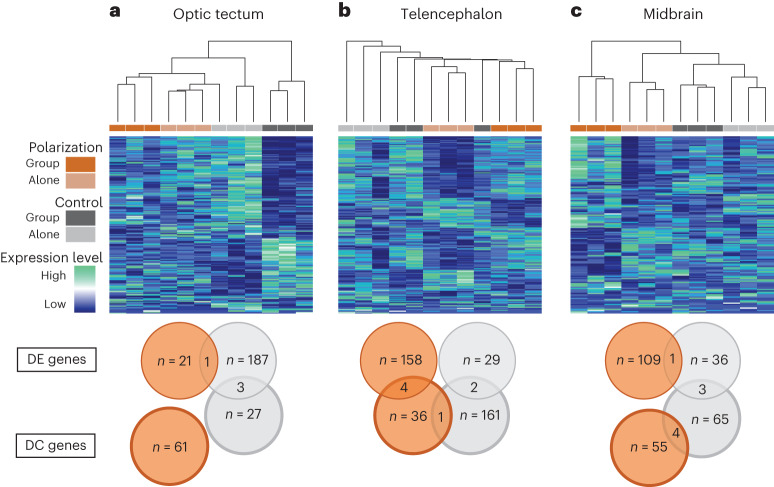
Fig. 3. Neurogenomic response of schooling in guppies.
a–c, Hierarchical clustering and relative expression levels for all differentially expressed genes between Alone and Group treatments in the optic tectum (a), the telencephalon (b) and the midbrain (c). Differentially expressed genes were identified separately in polarization and control line samples. Clustering, based on Euclidian distance, represents transcriptional similarity across all samples. Venn diagrams summarize the total number of DE genes and DC gene pairs in each tissue for polarization-selected and control lines.

