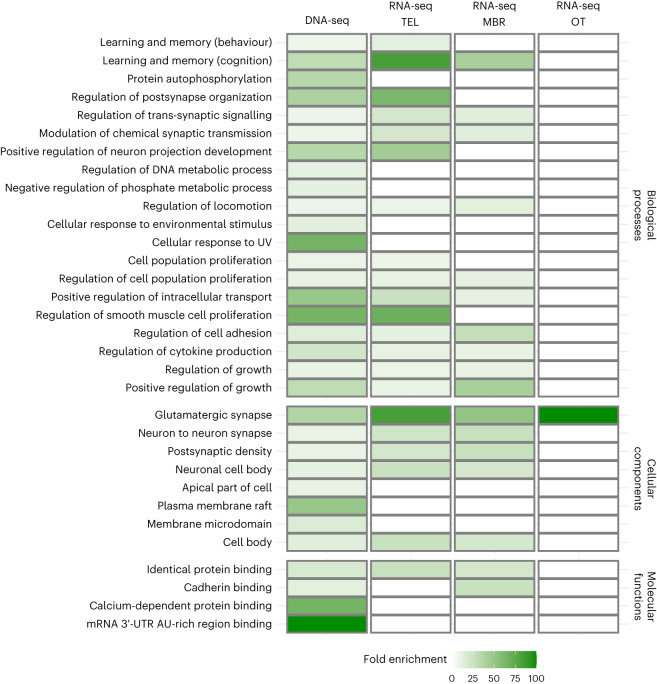
Fig. 4. Functional characterization of genes of interest across experiments.
Visualization of functional overlap based on GO annotations between genes of interest highlighted in strongly differentiated experimental setups evaluating social interactions of female guppies following experimental evolution for higher polarization: (1) genomic analyses of DNA comparing Pool-seq of high- and low-sociability female guppies (left column); (2) transcriptomic analyses evaluating differentially expressed genes in key brain regions of polarization-selected lines of female guppies exposed to two different social contexts: swimming alone or with a group of conspecifics (TEL, telencephalon; MBR, midbrain; OT, optic tectum; columns 2–4). Shades of green indicate fold enrichment from our statistical overrepresentation tests performed to gene lists obtained from each experiment (see Supplementary Dataset).

