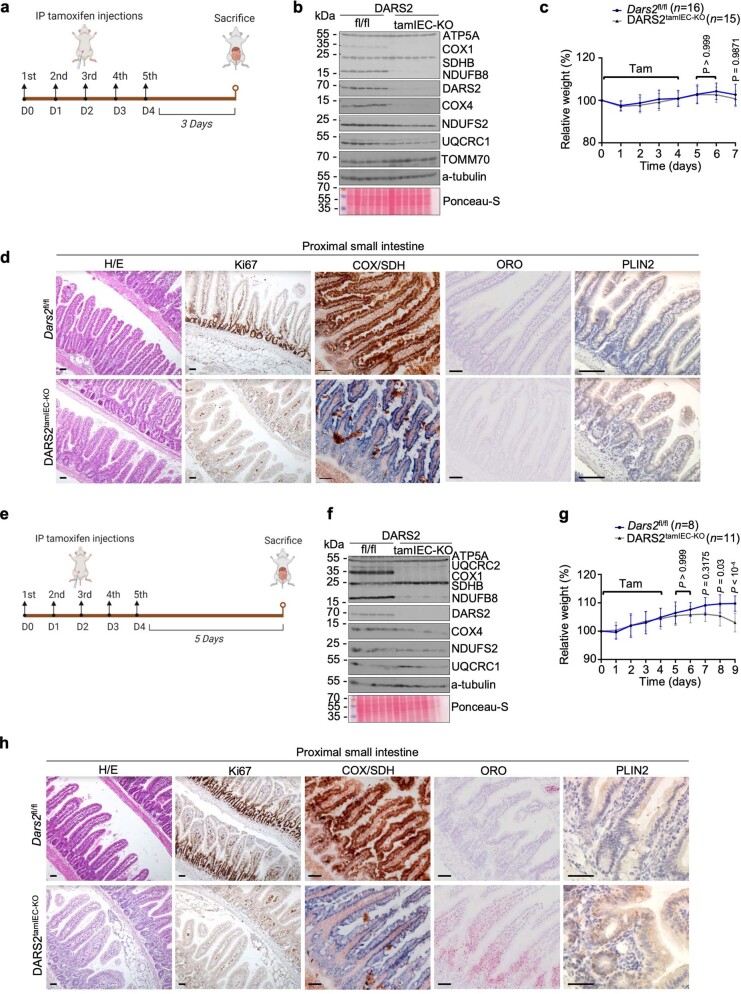
Extended Data Fig. 7. Analysis of respiratory subunit expression, IEC proliferation and lipid accumulation in DARS2tamIEC-KO mice 3 and 5 days after tamoxifen injection.
a, Schematic depiction of the experimental design created with BioRender.com. b, Immunoblot analysis with the indicated antibodies of proximal SI IEC protein extracts from Dars2fl/fl (n = 6) and DARS2tamIEC-KO (n = 6) mice 3 days after the last tamoxifen injection. c, Graph depicting relative body weight of Dars2fl/fl (n = 16) and DARS2tamIEC-KO (n = 15) mice after tamoxifen injection. d, Representative microscopic images of proximal SI sections from Dars2fl/fl and DARS2tamIEC-KO mice sacrificed 3 days upon the last tamoxifen injection stained with H&E, COX/SDH and ORO or immunostained with Ki67 and PLIN2. Scale bars, 50 μm. e, Schematic depiction of the experimental design created with BioRender.com. f, Immunoblot analysis with the indicated antibodies of proximal SI IEC protein extracts from Dars2fl/fl (n = 5) and DARS2tamIEC-KO (n = 6) mice 5 days after the last tamoxifen injection. g, Graph depicting relative body weight of Dars2fl/fl (n = 8) and DARS2tamIEC-KO (n = 11) mice after tamoxifen injection. h, Representative microscopic images of proximal SI sections from Dars2fl/fl and DARS2tamIEC-KO mice sacrificed 5 days upon the last tamoxifen injection stained with H&E, COX/SDH and ORO or immunostained with Ki67 and PLIN2. Scale bars, 50 μm. In c and g, data are represented as mean ± s.e.m and P values were calculated by two-way ANOVA with Bonferroni’s correction for multiple comparison. In b and f, each individual lane represents one mouse and α-tubulin was used as loading control. For gel source data, see Supplementary Fig. 1. In d and h, histological images shown are representative of the number of mice analysed as indicated in Supplementary Table 4.

