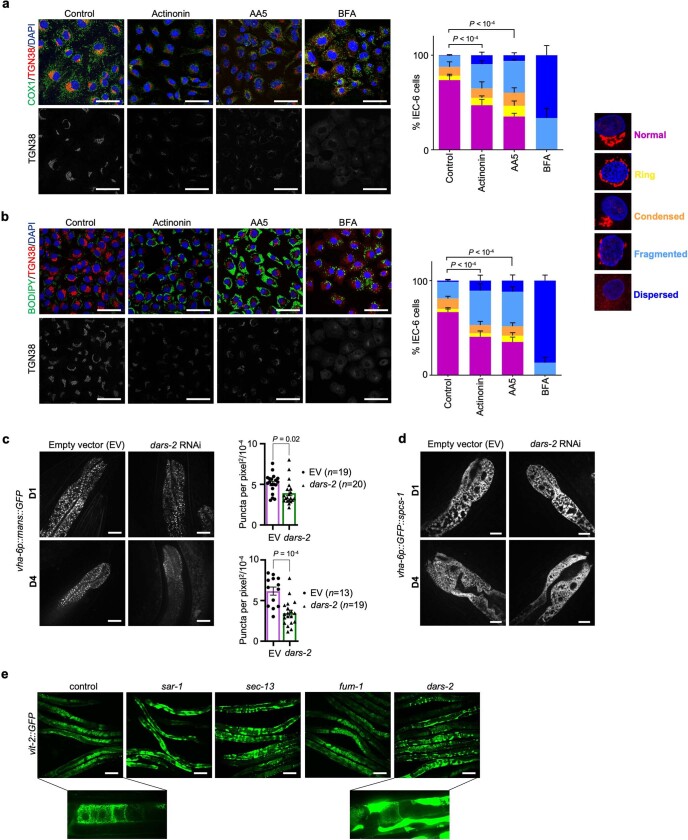
Extended Data Fig. 11. Mitochondrial dysfunction causes impairment of Golgi organisation and lipid processing in IEC-6 cells and in C. elegans.
a, Representative fluorescence microscopy images depicting IEC-6 cells treated for 48 h with actinonin (100 μM), Atpenin A5 (AA5, 1μM) or 1% dimethyl sulfoxide; DMSO (control). Short treatment (6 h) with Brefeldin A (BFA, 5 μg/ml) was used as a positive control for Golgi dispersal. Scale bars, 50 μm b, Representative fluorescence microscopy images of IEC-6 cells grown under the same conditions as described in a were incubated with oleic acid (OA, 600 μM) for the last 24 h prior imaging. In this case, BFA was applied in the last 6 h of OA treatment to avoid cytotoxicity. Anti-TGN38 (red) antibody was used to visualize Golgi, Anti-COX1(green) to stain mitochondrial networks (a), BODIPY (green) to stain lipid droplets (b), and DAPI (blue) for nuclei (top). TGN38 staining is additionally depicted in white (bottom). Scale bars, 50 μm. Quantification of the observed Golgi morphology of the IEC-6 cells based on five distinct categories, as illustrated at the right (n = 100–300 inspected IEC-6 cells from three independent biological experiments). c, Representative confocal images and graphs depicting quantification of GFP signal in C. elegans expressing α-mannosidase II fused to GFP under the control of the gut-specific vha-6 promoter grown either on a control empty vector (EV) or RNAi against dars-2 at the first (D1) and fourth day of adulthood (D4) (EV, n = 19 (D1), n = 13 (D4), dars-2, n = 20 (D1), n = 19 (D4)). Scale bars, 1 μm. d, Representative confocal images of GFP signal in C. elegans expressing SPCS-1 fused to GFP under the control of the gut-specific vha-6 promoter grown either on a control empty vector (EV) or RNAi against dars-2 at the first (D1) and fourth day of adulthood (D4) EV, n = 19 (D1), n = 19 (D4), dars-2, n = 20 (D1), n = 19 (D4)). Scale bars, 1 μm. e, Immunofluorescence micrographs of C. elegans carrying vit-2::GFP reporter on a control empty vector (EV) (n = 10) and RNAi against sar-1, sec-13, fum-1 and dars-2 at D1 (n = 10). Insets show magnification of a selected area of the worm. Scale bars, 100 μm. In bar graphs data are represented as mean ± s.e.m. and P values were calculated by two-sided Chi-squared test (a, b) and two-sided Student’s t-test with assumption of equal variance (c).

