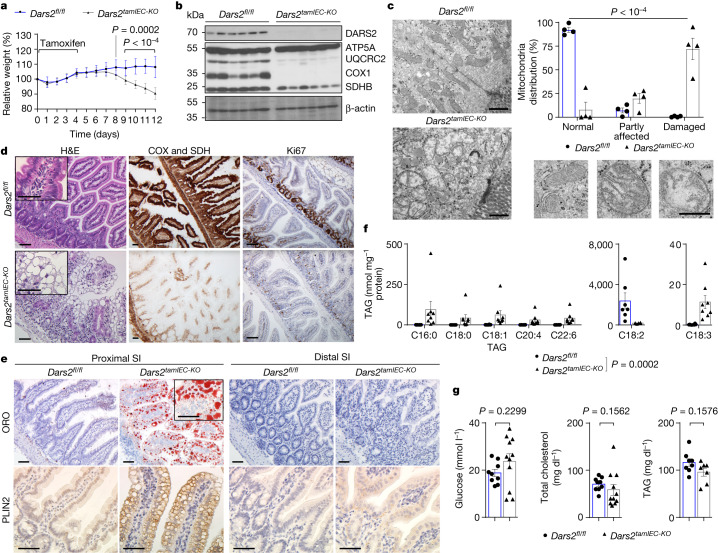
Fig. 2. Inducible DARS2 ablation in IECs of adult mice causes lipid accumulation in proximal enterocytes.
a, Relative body weight change of 8–12-week-old Dars2fl/fl and Dars2tamIEC-KO mice after tamoxifen administration (n = 21 per genotype). b, Immunoblot analysis with the indicated antibodies of protein extracts from SI IECs of Dars2fl/fl and Dars2tamIEC-KO mice 7 days after the last tamoxifen injection (n = 6 per genotype). β-actin was used as the loading control. c, Representative TEM micrographs of proximal SI sections and quantification of the mitochondria integrity distribution as a percentage of normal, partly affected and damaged mitochondria based on the electron density and cristae morphology in Dars2fl/fl mice (n = 4 mice, n = 663 mitochondria in n = 69 IECs) and Dars2tamIEC-KO mice (n = 4 mice, n = 707 mitochondria in n = 80 IECs) 7 days after tamoxifen. d, Representative images of sections from the proximal SI of Dars2tamIEC-KO and Dars2fl/fl mice stained with H&E, COX and SDH or immunostained with Ki67. e, Representative images of proximal and distal SI sections of Dars2fl/fl and Dars2tamIEC-KO mice stained with ORO or immunostained with PLIN2. f, TAG content in proximal SI of Dars2fl/fl and Dars2tamIEC-KO mice (n = 8 per genotype). g, Concentration of glucose, total cholesterol and TAGs in sera from Dars2fl/fl mice (n = 9 (glucose, total cholesterol), n = 8 (TAG)) and Dars2tamIEC-KO mice (n = 11 (glucose, total cholesterol), n = 7 (TAG)) 7 days after the last tamoxifen injection. In c, f and g, dots represent individual mice, bar graphs show the mean ± s.e.m. and P values were calculated using two-way analysis of variance (ANOVA) with Bonferroni’s correction for multiple comparison (a), two-sided chi-square test (c) or two-sided nonparametric Mann–Whitney U-test (f,g). In d,e, histological images are representative of the number of mice analysed as indicated in Supplementary Table 4. In b, each lane represents one mouse. Scale bars, 1 μm (c) or 50 μm (d,e). For gel source data, see Supplementary Fig. 1.

