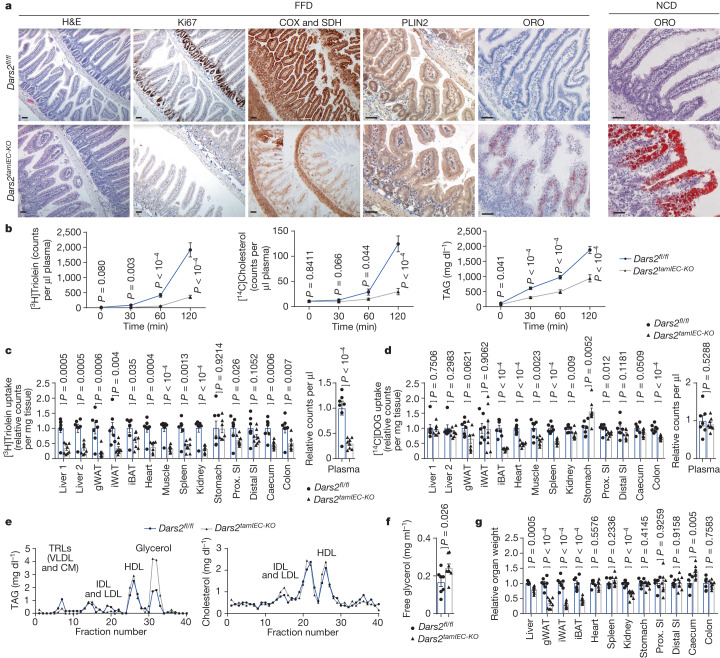
Fig. 3. DARS2 deficiency causes impaired transport of dietary lipids by enterocytes.
a, Representative images from the proximal SI of 8–12-week-old Dars2fl/fl and Dars2tamIEC-KO mice fed with a FFD or NCD diet 7 days after the last tamoxifen injection, stained with H&E, ORO and COX and SDH or immunostained with antibodies against Ki67 and PLIN2. Scale bar, 50 μm. b, [3H]Triolein, [14C]cholesterol and TAG content in portal plasma of Dars2fl/fl mice (n = 8) and Dars2tamIEC-KO mice (n = 8) subjected to oral fat tolerance tests after intravenous injection of tyloxapol. c,d, Counts of [3H]triolein (c) and [14C]DOG (d) in different organs and plasma from Dars2fl/fl mice (n = 7) and Dars2tamIEC-KO mice (n = 8) determined 120 min after oral gavage. iBAT, interscapular brown adipose tissue; gWAT, gonadal white adipose tissue; iWAT, inguinal white adipose tissue; Prox. proximal. Liver 1 and liver 2 correspond to two different parts of the liver. e, Fast-protein liquid chromatography profiles of TAG and cholesterol in pooled portal plasma from fasted Dars2fl/fl mice (n = 7) and Dars2tamIEC-KO mice (n = 8) 120 min after gavage. IDL, intermediate-density lipoprotein. f, Free glycerol levels in plasma from Dars2fl/fl mice (n = 7) and Dars2tamIEC-KO mice (n = 8). g, Relative organ weight of Dars2fl/fl mice (n = 7) and Dars2tamIEC-KO mice (n = 8) 7 days after the last tamoxifen injection subjected to oral glucose fat tolerance test. In c,d,f,g, dots represent individual mice, bar graphs show the mean ± s.e.m. and P values were calculated using unpaired two-sided Student’s t-test with no assumption of equal variance (b–d,f,g). In a, histological images are representative of the number of mice analysed as indicated in Supplementary Table 4.

