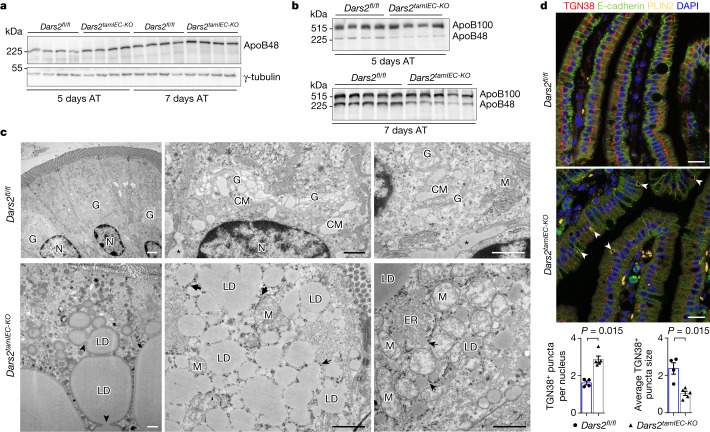
Fig. 4. DARS2 deficiency impairs CM production and induces progressive Golgi disorganization that precedes LD accumulation in enterocytes.
a,b, Immunoblots depicting expression levels of ApoB48 in SI IECs (a) and ApoB48 and ApoB100 on TRLs isolated from plasma by ultracentrifugation (b) from Dars2fl/fl and Dars2tamIEC-KO mice 5 and 7 days after the last tamoxifen injection (a, n = 4 mice per genotype, per indicated time point; b, n = 5 mice per genotype at 7 days after tamoxifen, n = 4 mice per genotype at 5 days after tamoxifen). γ-tubulin was used as the loading control (a). AT, after tamoxifen. c, Representative TEM micrographs from proximal SI sections of Dars2fl/fl mice (n = 4) and Dars2tamIEC-KO mice (n = 4) 7 days after the last tamoxifen injection. Note the lack of CM-containing Golgi complexes and the appearance of aberrant numbers of LDs and damaged mitochondria in DARS2-deficient enterocytes. Asterisks indicate CMs secreted in the basolateral intercellular space. Arrows point at lipid particles within the ER lumen in rough and smooth ER neighbouring areas. Arrowheads point at LD lateral fusion. N, nucleus. d, Top, representative fluorescence microscopy images from the proximal SI of 8–12-week-old Dars2fl/fl mice (n = 6) and Dars2tamIEC-KO mice (n = 6) immunostained with antibodies against TGN38, E-cadherin and PLIN2. Nuclei stained with DAPI. Arrowheads point at LDs. Bottom, quantification of the TGN38-positive puncta size and the number of puncta per nucleus from confocal images of proximal SI sections of Dars2fl/fl mice (n = 4) and Dars2tamIEC-KO mice (n = 5) 5 days after the last tamoxifen injection. In d, dots represent individual mice, bar graphs show the mean ± s.e.m. and P values were calculated using unpaired two-sided Student’s t-test with no assumption of equal variance. In a,b, each lane represents one mouse from two independent experiments. Scale bars, 1 μm (c) or 50 μm (d). For gel source data, see Supplementary Fig. 1.

