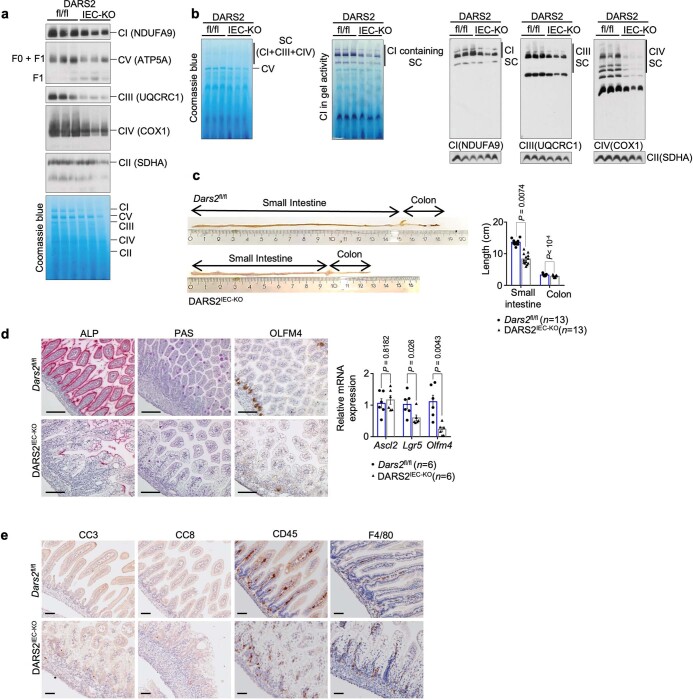
Extended Data Fig. 1. Depletion of respiratory complex subunits and intestinal pathology in DARS2IEC-KO mice.
BN-PAGE analysis of (a) individual respiratory complexes, or (b) supercomplexes in mitochondria isolated from the SI of 7-day-old Dars2fl/fl (fl/fl) and DARS2IEC-KO (IEC-KO) mice. Respiratory complexes were visualized by immunoblotting with indicated antibodies (a, b). The activity of supercomplex-associated Complex I was determined with in-gel assay (b). Coomassie blue stains and Complex II levels (anti-SDHA) were used as the loading controls (a, b). c, Representative pictures and quantification of the length of the SI and colon in 7-day-old DARS2IEC-KO (n = 13) and Dars2fl/fl littermates (n = 13). d, Representative images of SI sections from Dars2fl/fl and DARS2IEC-KO mice stained with PAS and ALP or immunostained against OLFM4 and graph depicting relative mRNA expression of the indicated genes measured by RT-qPCR in the SI from 7-day-old Dars2fl/fl (n = 6) and DARS2IEC-KO (n = 6) mice normalized to Tbp. e, Representative images of SI sections from Dars2fl/fl and DARS2IEC-KO mice immunostained against CC3, CC8, CD45 and F4/80. Scale bars, 50 μm (d, e). PAS, Periodic acid- Schiff; ALP, Alkaline Phosphatase; OLFM4, Olfactomedin 4, CC3, Cleaved Caspase 3, CC8, Cleaved Caspase 8. In c and d, dots represent individual mice, bar graphs show mean ± s.e.m. and P values were calculated by two-sided nonparametric Mann-Whitney U -test. In a and b, each individual lane represents mitochondria isolated from one mouse (n = 3 per genotype). For gel source data, see Supplementary Fig. 1. In d and e, histological images shown are representative of the number of mice analysed as indicated in Supplementary Table 4.

