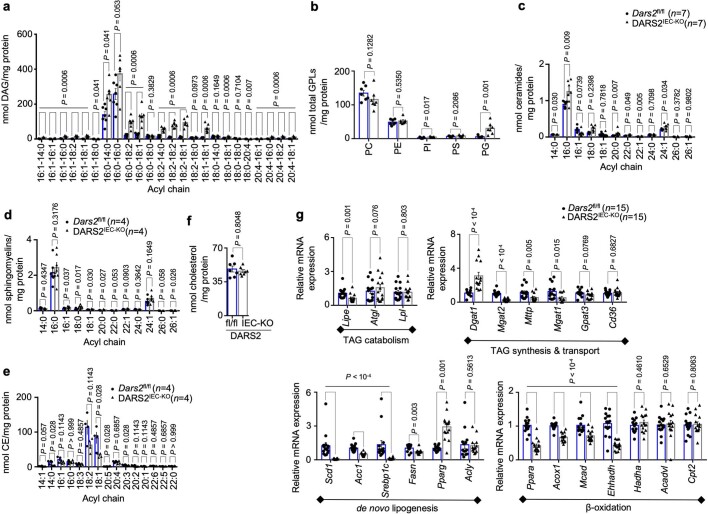
Extended Data Fig. 2. Impaired lipid homeostasis in the intestines of DARS2IEC-KO mice.
a-f, Graphs depicting quantification of DAG (a), GPLs (b), ceramides (c), sphingomyelins (d), CEs (e), and total cholesterol levels (f) in SI tissues from 7-day-old Dars2fl/fl and DARS2IEC-KO mice (n = 7, DAG, GLPs, ceramides, sphingomyelins, total cholesterol and n = 4, CE per genotype). g, Graph depicting relative mRNA expression of lipid-regulating genes associated with the indicated processes and measured by RT-qPCR in the total distal SI of 7-day-old Dars2fl/fl (n = 15) and DARS2IEC-KO (n = 15) mice normalized to Hprt1. In all graphs, dots represent individual mice, bar graphs show mean ± s.e.m. and P values were calculated by two-sided nonparametric Mann-Whitney U -test. DAG, Diacylglycerol, GLPs, Glycerophospholipids, PC, phosphatidylcholine, PE, phosphatidylethanolamine, PI, phosphatidylinositol, PS, phosphatidylserine, PG, phosphatidylglycerol, CE, cholesterol esters.

