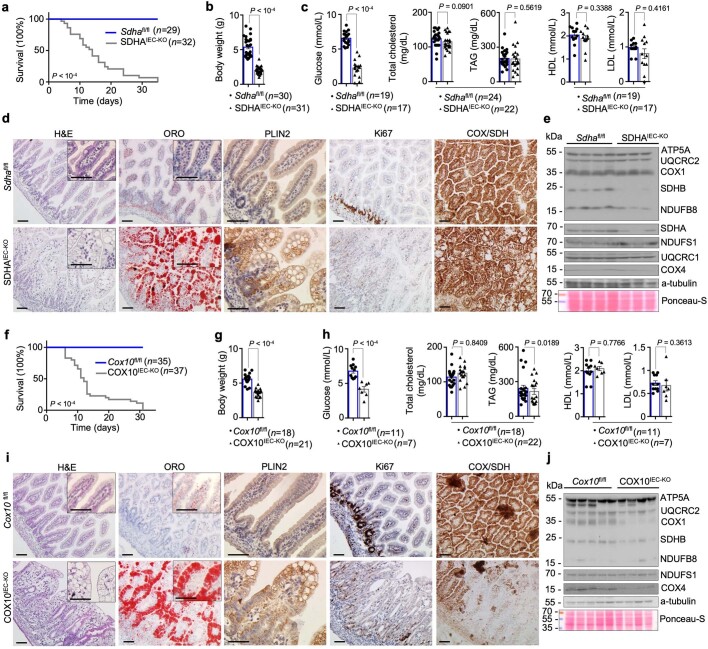
Extended Data Fig. 3. IEC-specific ablation of SDHA or COX10 causes lipid accumulation in large LDs in enterocytes.
a-c, Graphs depicting Kaplan-Meier survival curve (a), body weight (b) serum levels of glucose, total cholesterol, TAGs, HDL- and LDL-cholesterol (c) of Sdhafl/fl (n = 29 (a), n = 30 (b), n = 19 (glucose, HDL- and LDL- cholesterol), n = 24 (total cholesterol, TAG) (c)) and SDHAIEC-KO (n = 32 (a), n = 31 (b), n = 17 (glucose, HDL- and LDL-cholesterol), n = 22 (total cholesterol, TAG) (c)) mice at the age of 7 days. d, Representative images of SI sections from Sdhafl/fl and SDHAIEC-KO mice stained with H&E, COX-SDH and ORO or immunostained for PLIN2 and Ki67. Scale bars, 50 μm. e, Immunoblot analysis of IEC protein extracts from 7-day-old Sdhafl/fl (n = 4) and SDHAIEC-KO (n = 3) mice with the indicated antibodies. f, g, h Graphs depicting Kaplan-Meier survival curve (f), body weight (g) serum levels of glucose, total cholesterol, TAGs, HDL- and LDL-cholesterol (h) of 7-day-old Cox10fl/fl (n = 35 (f), n = 18 (g), n = 11 (glucose, HDL- and LDL-cholesterol), n = 18 (total cholesterol, TAG) (h)) and COX10IEC-KO (n = 37 (f), n = 21 (g), n = 7 (glucose, HDL- and LDL-cholesterol), n = 22 (total cholesterol, TAG) (h)) mice. i, Representative images of SI sections from Cox10fl/fl and COX10IEC-KO mice stained with H&E, COX-SDH and ORO or immunostained for PLIN2 and Ki67. Scale bars, 50 μm. j, Immunoblot analysis of IEC protein extracts from 7-day-old Cox10fl/fl (n = 5) and COX10IEC-KO (n = 4) mice with the indicated antibodies. In b, c, g and h, dots represent individual mice, bar graphs show mean ± s.e.m. and P values were calculated by two-sided nonparametric Mann-Whitney U -test. In a and f, P values were calculated by two-sided Gehan-Breslow-Wilcoxon test. In d and i, histological images shown are representative of the number of mice analysed as indicated in Supplementary Table 4. In i and j, each lane represents one mouse and α-tubulin was used as loading control. For gel source data, see Supplementary Fig. 1.

