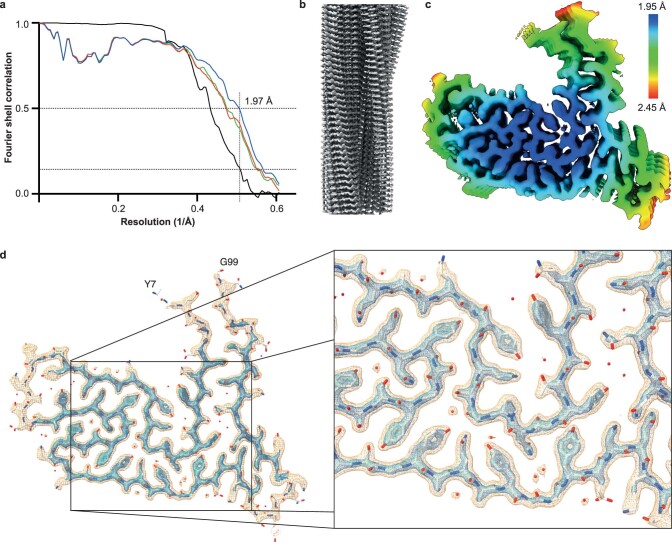
Extended Data Fig. 5. A high-resolution map of TAF15 amyloid filaments from FTLD-FET.
a, Fourier shell correlation (FSC) curves for two independently refined half maps from individual 1 (black line); for the refined atomic model against the cryo-EM density map (blue); and for the atomic model shaken and refined against the first (green) or second (red) independent half map. FSC thresholds of 0.143 and 0.5, as well as a vertical line at the estimated map resolution of 1.97 Å are plotted. b, The map viewed along the helical axis, showing well-resolved individual TAF15 molecules. c, The map with rainbow-coloured local resolution estimates viewed perpendicular to the helical axis. d, The map, shown at contour levels of 0.015 (orange) and 0.0345 (blue), viewed for a single TAF15 molecule perpendicular to the helical axis, shows a well-resolved backbone and clear side-chain densities, including aromatic rings of tyrosine residues.

