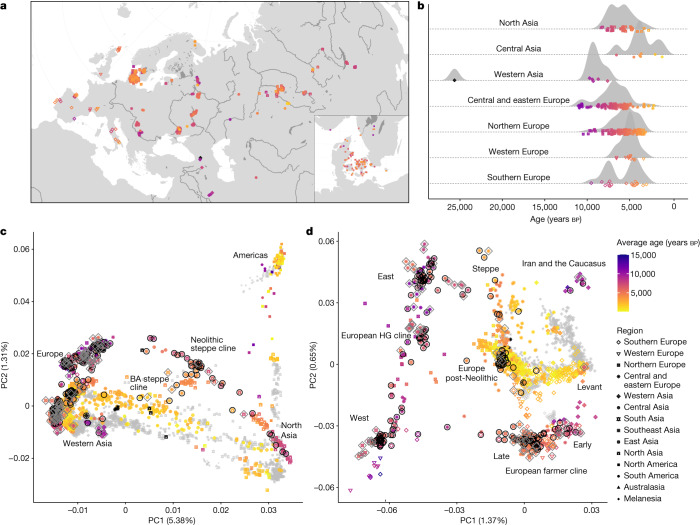
Fig. 1. Sample overview and broad-scale genetic structure.
a,b, Geographical (a) and temporal (b) distribution of the 317 ancient genomes sequenced and reported in this study. Insert shows dense sampling in Denmark34. The age and the geographical region of ancient individuals are indicated by the colour and the shape of the symbols, respectively. Colour scale for age is capped at 15,000 years; older individuals are indicated with black. Random jitter was added to geographical coordinates to avoid overplotting. c,d, PCA of 3,316 modern and ancient individuals from Eurasia, Oceania and the Americas (c), and restricted to 2,126 individuals from western Eurasia (west of the Urals) (d). Principal components were defined using both modern and imputed ancient (n = 1,492) genomes passing all filters, with the remaining low-coverage ancient genomes projected. Ancient genomes sequenced in this study are indicated with black circles (imputed genomes passing all filters, n = 213) or grey diamonds (pseudo-haploid projected genomes; n = 104). Genomes of modern individuals are shown in grey, with population labels corresponding to their median coordinates. BA, Bronze Age.

