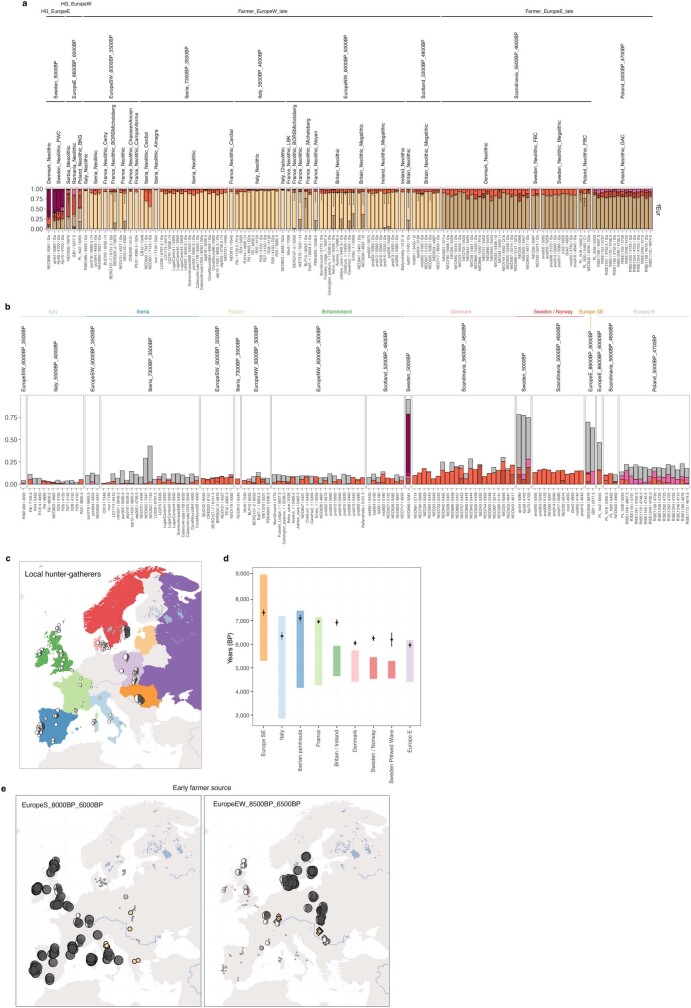
Extended Data Fig. 8. Dynamics of the Neolithic transition in Europe.
a, Supervised ancestry modelling using non-negative least squares on IBD sharing profiles. Panels show estimated ancestry proportions for target individuals from genetic clusters representing European Neolithic farmer individuals (“fEur” source set). Individuals used as sources in a particular set are indicated with black crosses and coloured bars with 100% ancestry proportion. Black lines indicate 1 standard error for the respective ancestry component. b, Composition of HG ancestry proportions from different source groups in individuals with Neolithic farmer ancestry, shown as bar plots. Grey bars represent contributions from a source with ancestry related to local HGs. c, Moon charts showing spatial distribution of estimated ancestry proportions related to local HGs across Europe. Estimated ancestry proportions are indicated by size and amount of fill of moon symbols. Coloured areas indicate the geographical extent of individuals included as local sources in the respective regions. d, Estimated time of admixture between local HG groups and Neolithic farmers. Black diamonds and error bars represent point estimate and standard errors of admixture time, coloured bars show temporal range of included target individuals. The time to admixture was adjusted backwards by the average age of individuals for each region. e, Moon charts showing spatial distribution of estimated ancestry proportions derived from genetic clusters of early Neolithic European farmers (locations indicated with coloured symbols). Estimated ancestry proportions are indicated by size and amount of fill of moon symbols. Red symbols indicate individuals where standard errors exceed the point estimates for the respective ancestry source.

