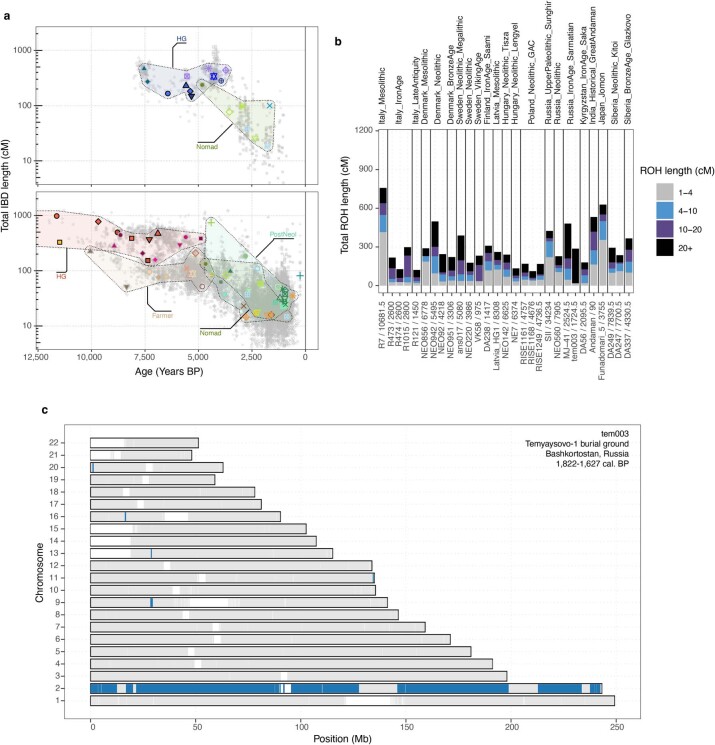
Extended Data Fig. 11. Patterns of co-ancestry.
a, Panels show within-cluster genetic relatedness over time, measured as the total length of genomic segments shared IBD between individuals. Results for both measures are shown separately for individuals from western versus eastern Eurasia. Small grey dots indicate estimates for individual pairs, with larger coloured symbols indicating median values within genetic clusters. Ranges of median values for major ancestry groups are indicated with labelled convex hulls. b, Distribution of ROH lengths for 29 individuals with evidence for recent parental relatedness (>50 cM total in ROHs > 20 cM). c, Karyogram showing genomic distribution of ROH in individual tem003, an ancient case of uniparental disomy for chromosome 2. Regions within ROH are indicated with blue colour.

