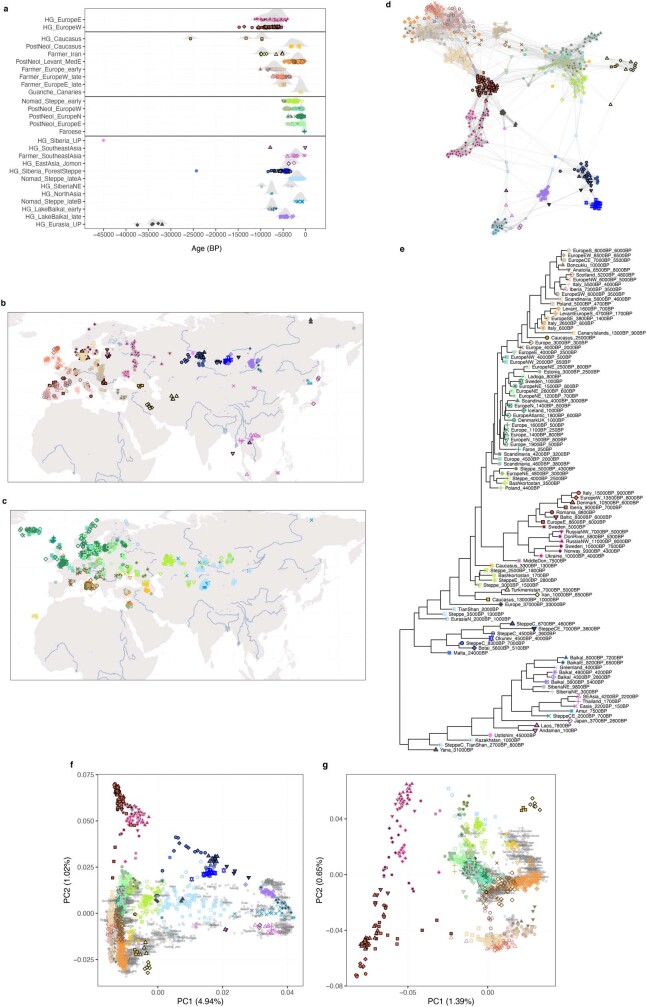
Extended Data Fig. 3. Genetic clustering of ancient individuals.
Characterization of genetic clusters for 1,401 imputed ancient individuals from Eurasia (that is, excluding 91 individuals from Africa and Americas), inferred from pairwise IBD sharing (indicated using coloured symbols throughout), a, Temporal distribution of clustered individuals, grouped by broad ancestry cluster. b,c, Geographical distribution of clustered individuals, shown for individuals predating 3,000 bp (b) and after 3,000 bp (c). d, Network graph of pairwise IBD sharing between 596 ancient Eurasians predating 3,000 bp, highlighting within- and between-cluster relationships. Each node represents an individual, and the width of edges connecting nodes indicates the fraction of the genome shared IBD between the respective pair of individuals. Network edges were restricted to the 10 highest sharing connections for each individual, and the layout was computed using the force-directed Fruchterman-Reingold algorithm. e, Neighbour-joining tree showing relationships between genetic clusters, inferred using total variation distance (TVD) of IBD painting palettes. f,g, PCA of 3,119 Eurasian (f) or 2,126 west Eurasian (g) ancient and modern individuals (“HO” dataset).

