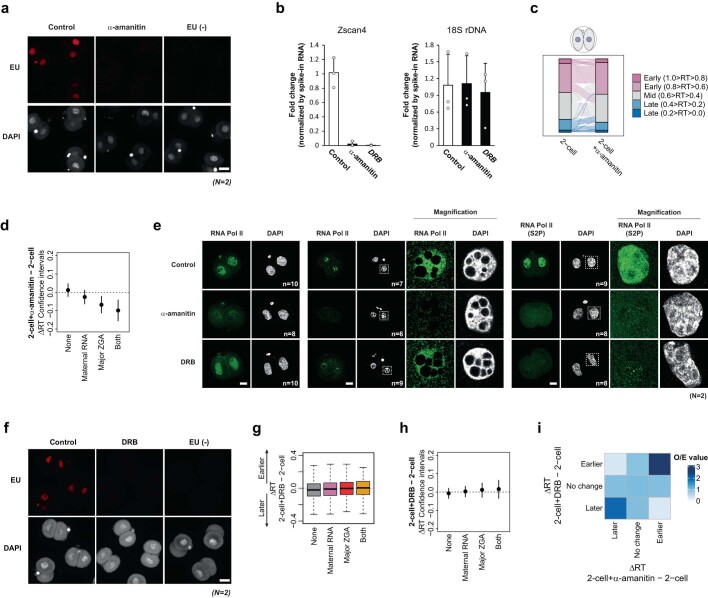
Extended Data Fig. 8. Effect of RNA Pol II inhibition by α-amanitin and DRB on the embryonic RT programme.
a. Visualisation of global transcription during minor and major ZGA by EU click chemistry and efficient inhibition of ZGA using α-amanitin. Representative embryos of a total of 24 (control), 19 (α-amanitin treated) or 19 non-EU treated embryos (EU-) are shown. Scale bar, 50 μm. b. Taqman RT-qPCR analysis for Zscan4 cluster and rDNA after α-amanitin and DRB treatment. Barplots show mean ± s.d and dots indicate the values of independent biological replicates. c. Alluvial plot indicating the RT values categorised in 5 groups from the earliest (1.0 ≥ RT > 0.8) to latest RT (0.2 > RT ≥ 0.0) across the genome in control 2-cell embryos and their changes upon α-amanitin treatment. d. Confidence intervals for the changes in RT (ΔRT) upon α-amanitin treatment of genomic bins containing maternally expressed genes or major ZGA genes. ‘Both’ refers to bins containing ZGA genes and maternally expressed genes, whereas ‘None’ does not overlap with any of the two categories. e. Immunostaining of RNA Pol II using an antibody recognizing all forms of RNA Pol II or an antibody against its CTD Serine 2 phosphorylated form (S2P) after α-amanitin or DRB treatment with (right) and without (left) Triton pre-extraction. Representative single confocal sections are shown. Total number of embryos (n) analysed in each conditions from two independent experiments (N) are shown. Scale bars, 25 μm. We note that α-amanitin leads to degradation of RNA PolII in our experimental conditions. f. Visualisation of global transcription during minor and major ZGA by EU click chemistry and efficient inhibition of ZGA upon DRB treatment. Representative embryos from two independent experimetns (N) are shown. Scale bar, 50 μm. g. Difference of RT values (ΔRT) between DRB-treated and untreated 2-cell embryos at genomic bins overlapping only major ZGA genes, only maternal RNA genes, or both genes compared to non-overlapping bins (None). Box plots show median and the interquartile range (IQR), whiskers depict the smallest and largest values within 1.5 ×IQR. h. Confidence intervals for the changes in RT (ΔRT) upon DRB treatment of genomic bins containing maternally expressed genes or Major ZGA genes. ‘Both’ refers to bins containing ZGA genes and maternally expressed genes, ‘None’ does not overlap with any of the two categories. i. Enrichment of genomic regions displaying significant changes in RT upon α-amanitin treatment with bins that display changes in RT upon DRB treatment in 2-cell stage embryos. Observed over expected number of bins is shown (O/E). In d and h, the dot represents the mean of 1000 bootstrapped values. Error bars indicate the 95% bootstrap confidence interval.

